Zip Codes with the Highest Percentage of Population Employed in Transportation & Warehousing in Clarksville, TN
RELATED REPORTS & OPTIONS
Transportation & Warehousing
Clarksville
Compare Zip Codes
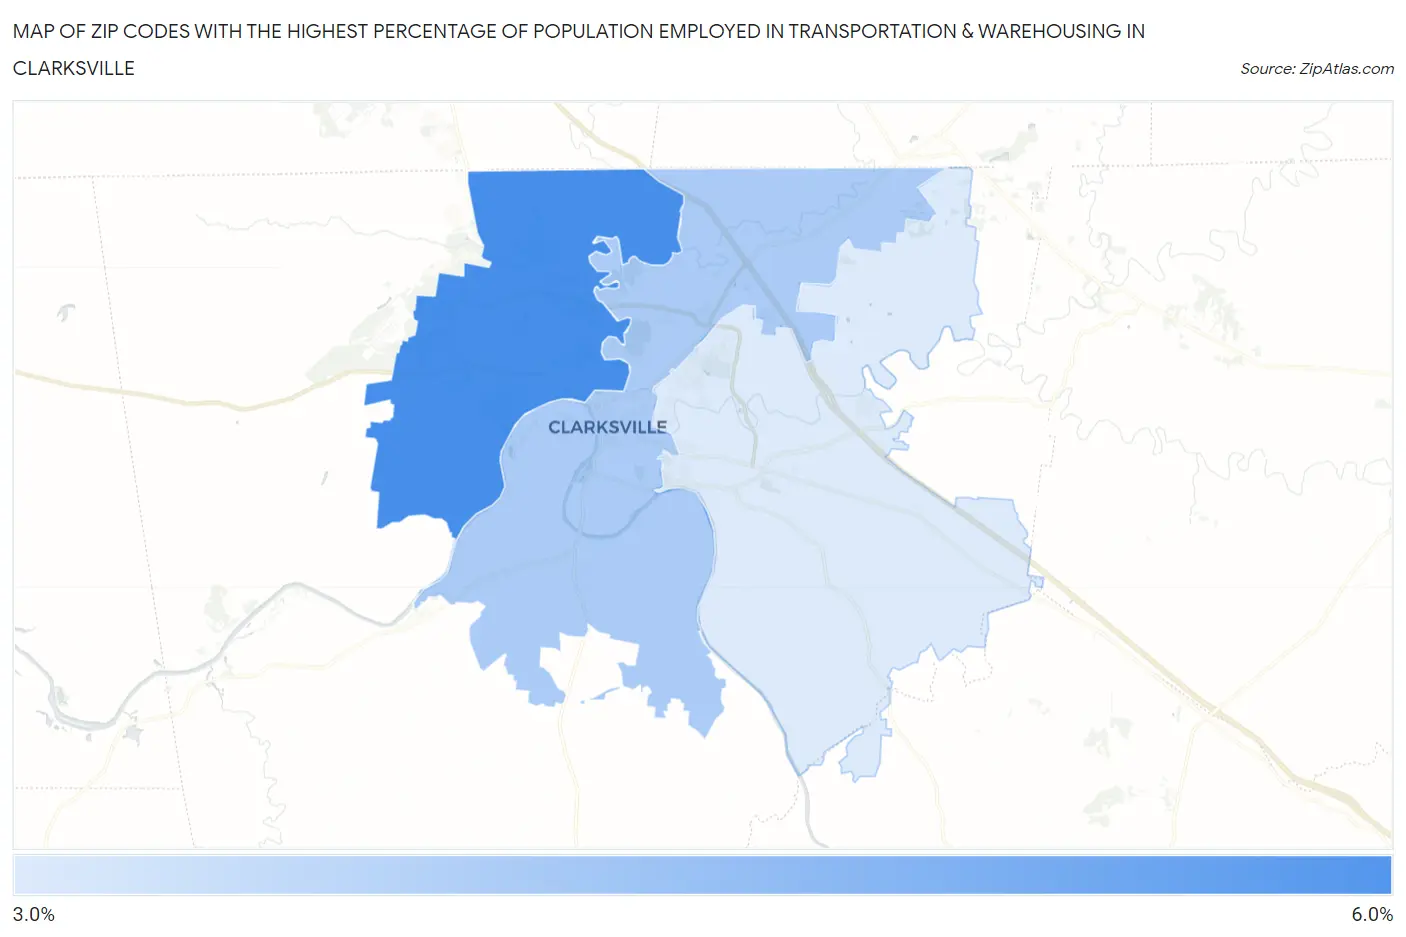
Map of Zip Codes with the Highest Percentage of Population Employed in Transportation & Warehousing in Clarksville
0.0%
6.0%
Zip Codes with the Highest Percentage of Population Employed in Transportation & Warehousing in Clarksville, TN
| Zip Code | % Employed | vs State | vs National | |
| 1. | 37042 | 5.2% | 6.1%(-0.908)#287 | 4.9%(+0.257)#11,229 |
| 2. | 37040 | 3.9% | 6.1%(-2.20)#401 | 4.9%(-1.03)#16,303 |
| 3. | 37043 | 3.2% | 6.1%(-2.87)#451 | 4.9%(-1.70)#19,159 |
1
Common Questions
What are the Top Zip Codes with the Highest Percentage of Population Employed in Transportation & Warehousing in Clarksville, TN?
Top Zip Codes with the Highest Percentage of Population Employed in Transportation & Warehousing in Clarksville, TN are:
What zip code has the Highest Percentage of Population Employed in Transportation & Warehousing in Clarksville, TN?
37042 has the Highest Percentage of Population Employed in Transportation & Warehousing in Clarksville, TN with 5.2%.
What is the Percentage of Population Employed in Transportation & Warehousing in Clarksville, TN?
Percentage of Population Employed in Transportation & Warehousing in Clarksville is 4.5%.
What is the Percentage of Population Employed in Transportation & Warehousing in Tennessee?
Percentage of Population Employed in Transportation & Warehousing in Tennessee is 6.1%.
What is the Percentage of Population Employed in Transportation & Warehousing in the United States?
Percentage of Population Employed in Transportation & Warehousing in the United States is 4.9%.