Zip Codes with the Highest Percentage of Population Walking to Work in Spearfish, SD
RELATED REPORTS & OPTIONS
Walk to Work
Spearfish
Compare Zip Codes
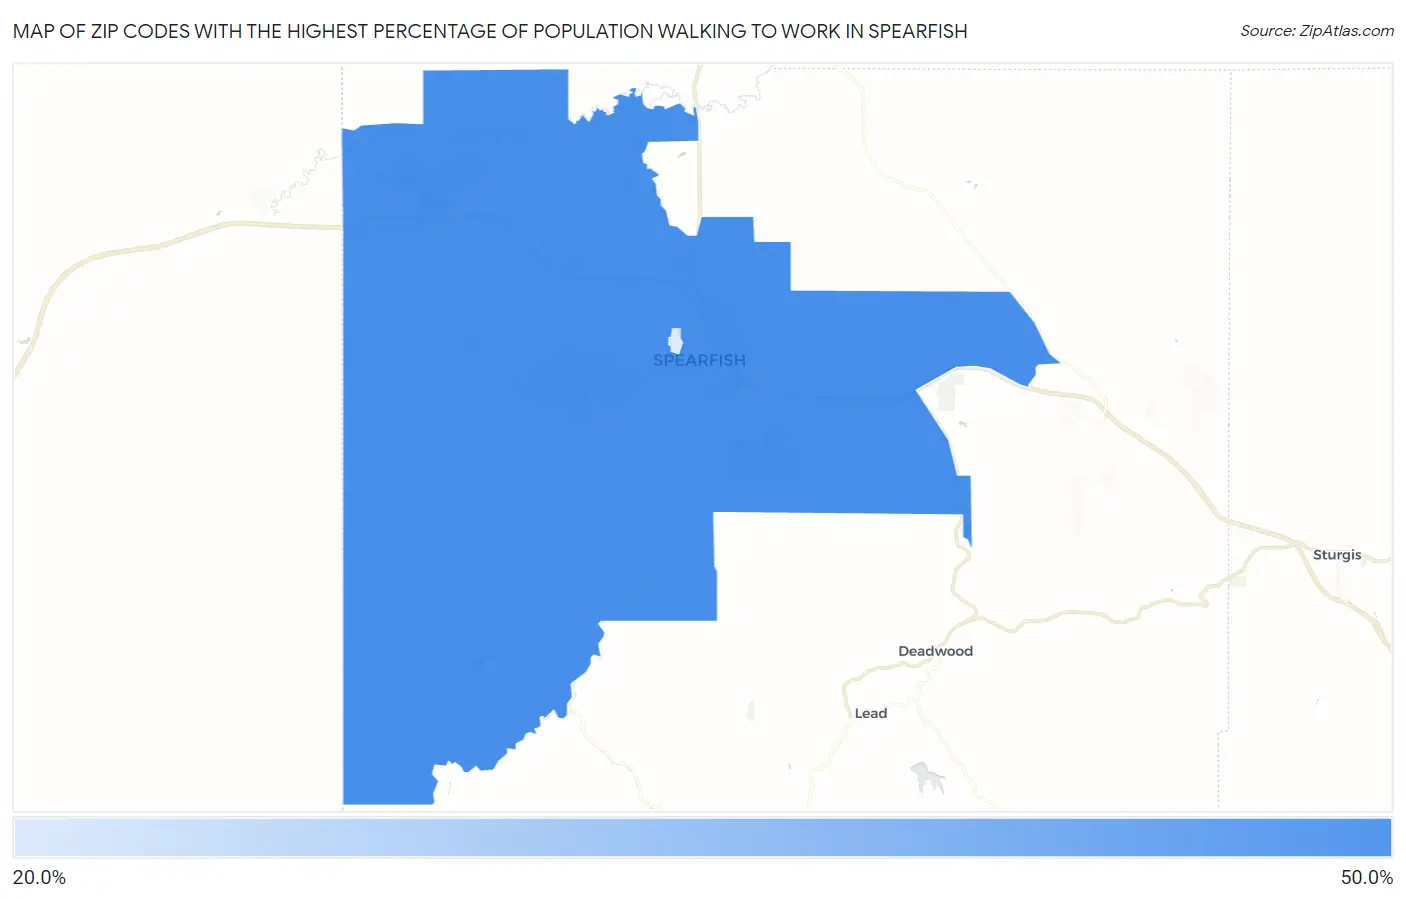
Map of Zip Codes with the Highest Percentage of Population Walking to Work in Spearfish
20.5%
48.5%
Zip Codes with the Highest Percentage of Population Walking to Work in Spearfish, SD
| Zip Code | % Walk to Work | vs State | vs National | |
| 1. | 57783 | 48.5% | 38.0%(+10.5)#94 | 33.4%(+15.1)#5,074 |
| 2. | 57799 | 20.5% | 38.0%(-17.5)#195 | 33.4%(-12.9)#16,123 |
1
Common Questions
What are the Top Zip Codes with the Highest Percentage of Population Walking to Work in Spearfish, SD?
Top Zip Codes with the Highest Percentage of Population Walking to Work in Spearfish, SD are:
What zip code has the Highest Percentage of Population Walking to Work in Spearfish, SD?
57783 has the Highest Percentage of Population Walking to Work in Spearfish, SD with 48.5%.
What is the Percentage of Population Walking to Work in Spearfish, SD?
Percentage of Population Walking to Work in Spearfish is 36.2%.
What is the Percentage of Population Walking to Work in South Dakota?
Percentage of Population Walking to Work in South Dakota is 38.0%.
What is the Percentage of Population Walking to Work in the United States?
Percentage of Population Walking to Work in the United States is 33.4%.