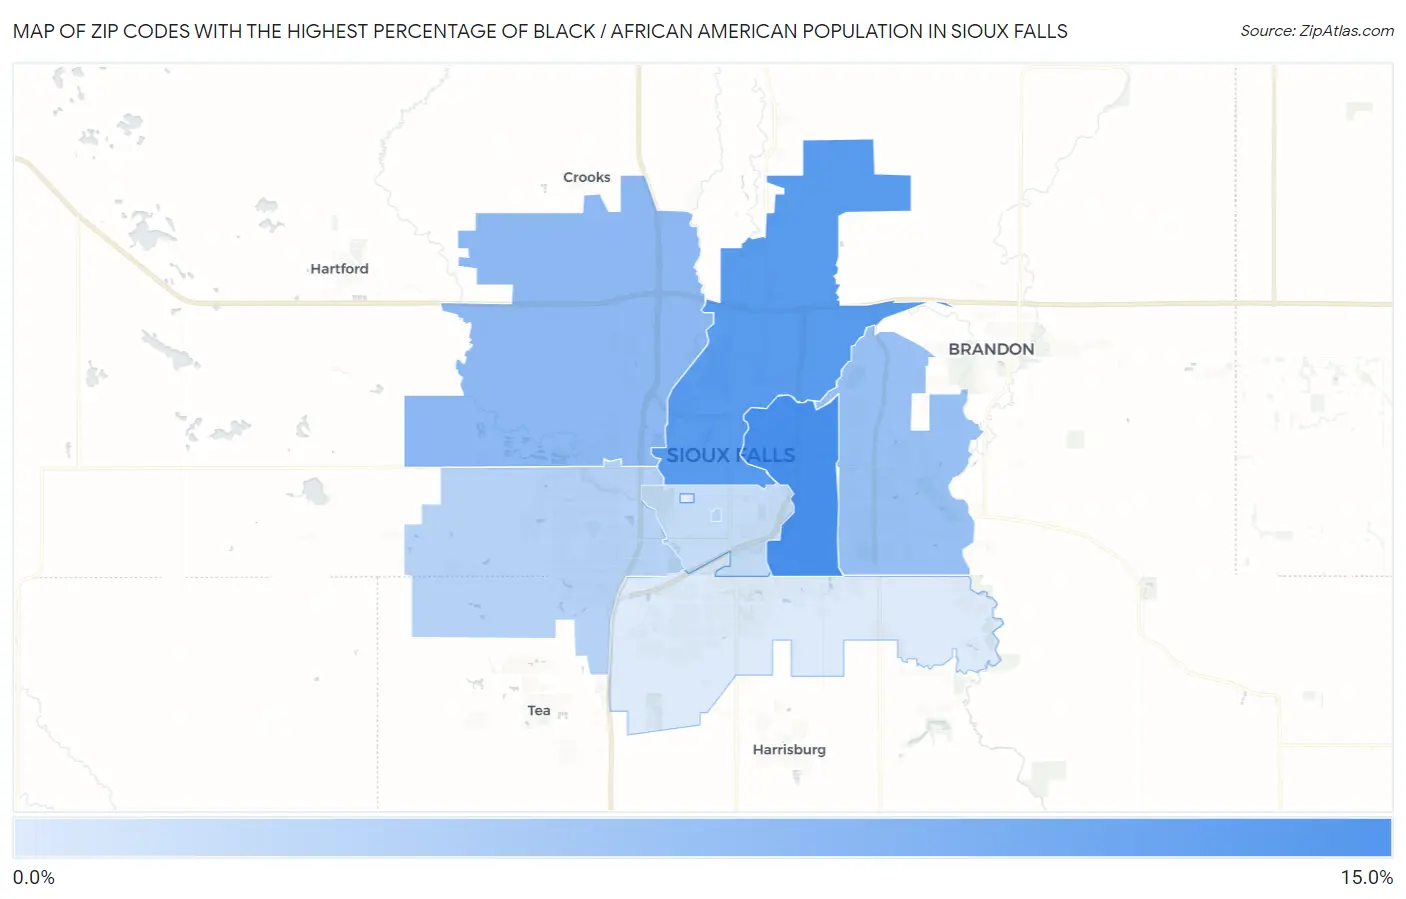
Zip Codes with the Highest Percentage of Black / African American Population in Sioux Falls, SD
RELATED REPORTS & OPTIONS
Black / African American
Sioux Falls
Compare Zip Codes
Map of Zip Codes with the Highest Percentage of Black / African American Population in Sioux Falls
2.2%
11.8%
Zip Codes with the Highest Percentage of Black / African American Population in Sioux Falls, SD
| Zip Code | Black / African American | vs State | vs National | |
| 1. | 57103 | 11.8% | 2.2%(+9.65)#5 | 12.5%(-0.624)#5,929 |
| 2. | 57104 | 10.7% | 2.2%(+8.52)#7 | 12.5%(-1.76)#6,348 |
| 3. | 57107 | 7.2% | 2.2%(+5.06)#9 | 12.5%(-5.22)#7,951 |
| 4. | 57110 | 6.6% | 2.2%(+4.40)#10 | 12.5%(-5.88)#8,345 |
| 5. | 57197 | 4.7% | 2.2%(+2.50)#13 | 12.5%(-7.78)#9,838 |
| 6. | 57106 | 4.7% | 2.2%(+2.46)#14 | 12.5%(-7.82)#9,876 |
| 7. | 57105 | 3.7% | 2.2%(+1.51)#17 | 12.5%(-8.77)#10,825 |
| 8. | 57108 | 2.2% | 2.2%(+0.027)#26 | 12.5%(-10.2)#13,107 |
1
Common Questions
What are the Top 5 Zip Codes with the Highest Percentage of Black / African American Population in Sioux Falls, SD?
Top 5 Zip Codes with the Highest Percentage of Black / African American Population in Sioux Falls, SD are:
What zip code has the Highest Percentage of Black / African American Population in Sioux Falls, SD?
57103 has the Highest Percentage of Black / African American Population in Sioux Falls, SD with 11.8%.
What is the Percentage of Black / African American Population in Sioux Falls, SD?
Percentage of Black / African American Population in Sioux Falls is 6.8%.
What is the Percentage of Black / African American Population in South Dakota?
Percentage of Black / African American Population in South Dakota is 2.2%.
What is the Percentage of Black / African American Population in the United States?
Percentage of Black / African American Population in the United States is 12.5%.