Zip Codes with the Highest Percentage of Households Heated by Bottled Gas / Liquid Propane in Summerville, SC
RELATED REPORTS & OPTIONS
Bottled Gas / LP Heating
Summerville
Compare Zip Codes
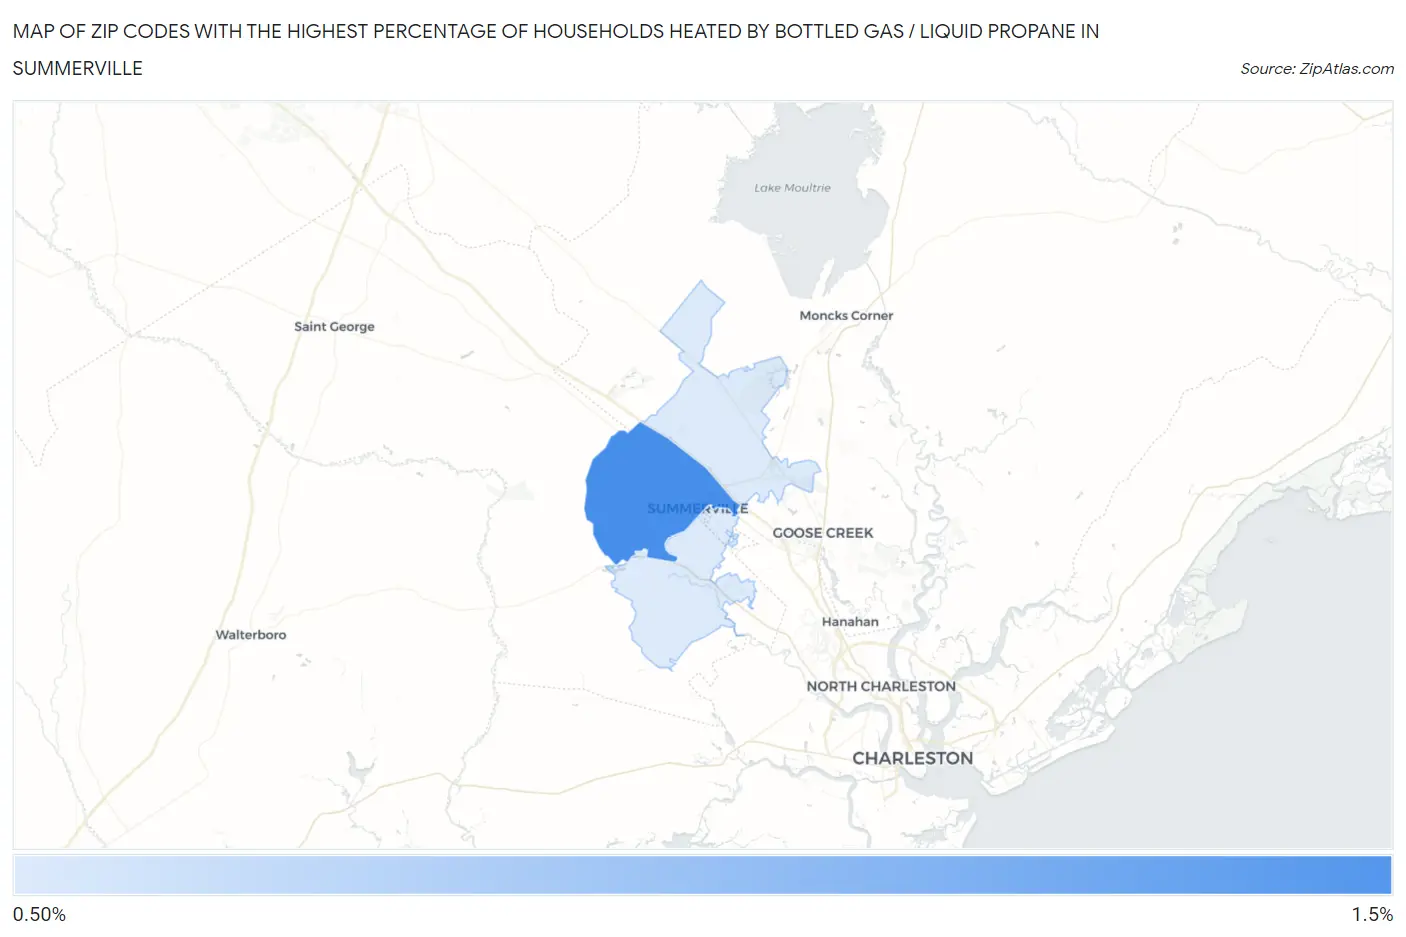
Map of Zip Codes with the Highest Percentage of Households Heated by Bottled Gas / Liquid Propane in Summerville
0.0%
1.5%
Zip Codes with the Highest Percentage of Households Heated by Bottled Gas / Liquid Propane in Summerville, SC
| Zip Code | Bottled Gas / LP Heating | vs State | vs National | |
| 1. | 29483 | 1.2% | 3.4%(-2.20)#331 | 4.9%(-3.70)#25,741 |
| 2. | 29485 | 0.70% | 3.4%(-2.70)#357 | 4.9%(-4.20)#27,745 |
| 3. | 29486 | 0.70% | 3.4%(-2.70)#358 | 4.9%(-4.20)#27,788 |
1
Common Questions
What are the Top Zip Codes with the Highest Percentage of Households Heated by Bottled Gas / Liquid Propane in Summerville, SC?
Top Zip Codes with the Highest Percentage of Households Heated by Bottled Gas / Liquid Propane in Summerville, SC are:
What zip code has the Highest Percentage of Households Heated by Bottled Gas / Liquid Propane in Summerville, SC?
29483 has the Highest Percentage of Households Heated by Bottled Gas / Liquid Propane in Summerville, SC with 1.2%.
What is the Percentage of Households Heated by Bottled Gas / Liquid Propane in Summerville, SC?
Percentage of Households Heated by Bottled Gas / Liquid Propane in Summerville is 0.70%.
What is the Percentage of Households Heated by Bottled Gas / Liquid Propane in South Carolina?
Percentage of Households Heated by Bottled Gas / Liquid Propane in South Carolina is 3.4%.
What is the Percentage of Households Heated by Bottled Gas / Liquid Propane in the United States?
Percentage of Households Heated by Bottled Gas / Liquid Propane in the United States is 4.9%.