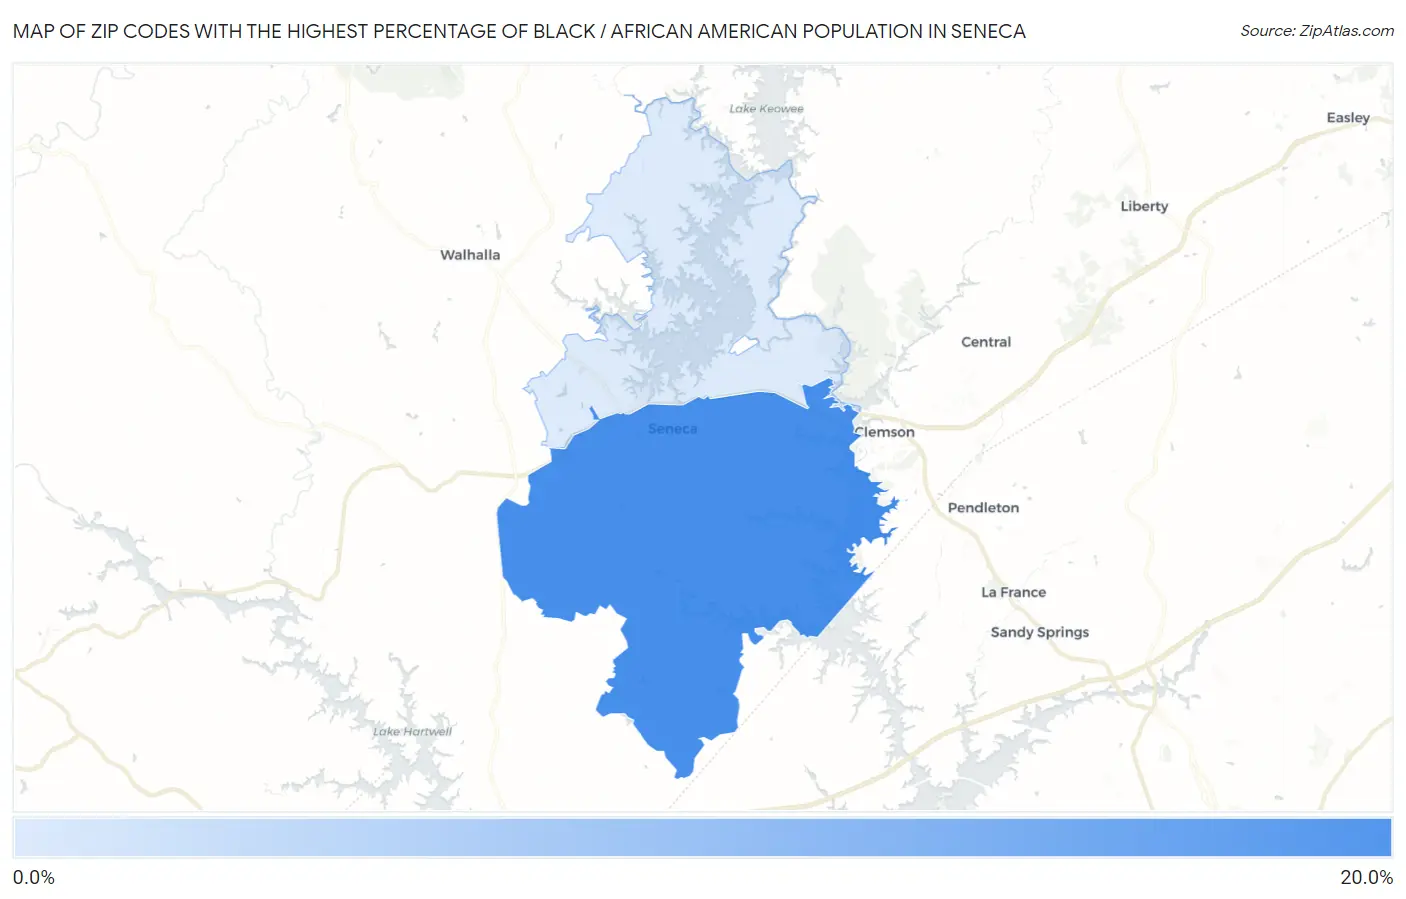
Zip Codes with the Highest Percentage of Black / African American Population in Seneca, SC
RELATED REPORTS & OPTIONS
Black / African American
Seneca
Compare Zip Codes
Map of Zip Codes with the Highest Percentage of Black / African American Population in Seneca
4.0%
16.9%
Zip Codes with the Highest Percentage of Black / African American Population in Seneca, SC
| Zip Code | Black / African American | vs State | vs National | |
| 1. | 29678 | 16.9% | 25.8%(-8.87)#273 | 12.5%(+4.44)#4,535 |
| 2. | 29672 | 4.0% | 25.8%(-21.8)#375 | 12.5%(-8.43)#10,463 |
1
Common Questions
What are the Top Zip Codes with the Highest Percentage of Black / African American Population in Seneca, SC?
Top Zip Codes with the Highest Percentage of Black / African American Population in Seneca, SC are:
What zip code has the Highest Percentage of Black / African American Population in Seneca, SC?
29678 has the Highest Percentage of Black / African American Population in Seneca, SC with 16.9%.
What is the Percentage of Black / African American Population in Seneca, SC?
Percentage of Black / African American Population in Seneca is 18.7%.
What is the Percentage of Black / African American Population in South Carolina?
Percentage of Black / African American Population in South Carolina is 25.8%.
What is the Percentage of Black / African American Population in the United States?
Percentage of Black / African American Population in the United States is 12.5%.