Zip Codes with the Highest Percentage of Population Employed in Arts, Entertainment & Recreation in Rock Hill, SC
RELATED REPORTS & OPTIONS
Arts, Entertainment & Recreation
Rock Hill
Compare Zip Codes
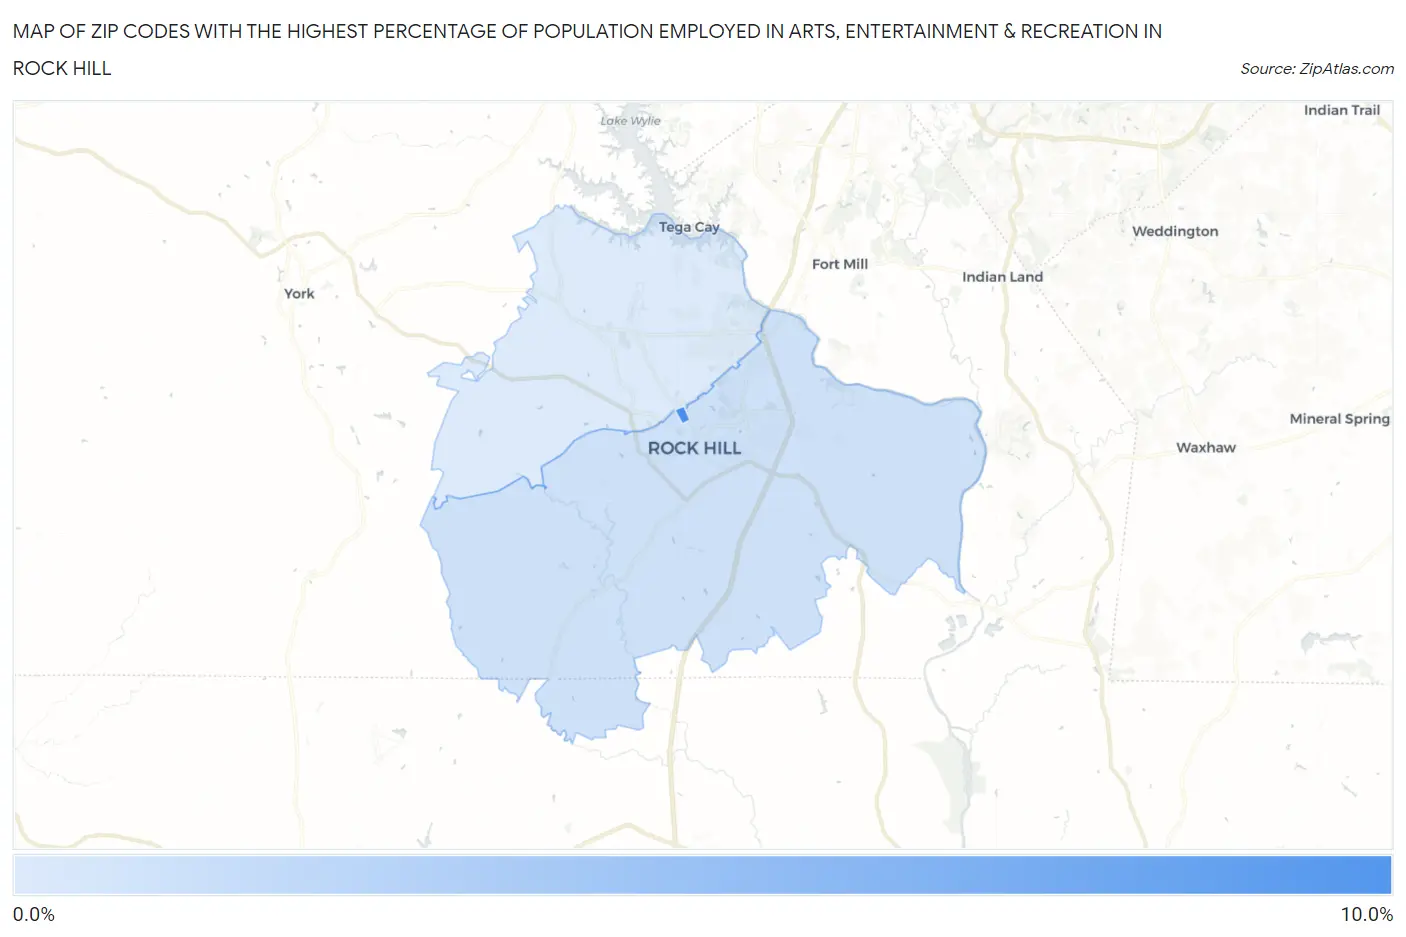
Map of Zip Codes with the Highest Percentage of Population Employed in Arts, Entertainment & Recreation in Rock Hill
0.0%
10.0%
Zip Codes with the Highest Percentage of Population Employed in Arts, Entertainment & Recreation in Rock Hill, SC
| Zip Code | % Employed | vs State | vs National | |
| 1. | 29733 | 9.4% | 1.8%(+7.68)#10 | 2.1%(+7.36)#784 |
| 2. | 29730 | 1.7% | 1.8%(-0.064)#126 | 2.1%(-0.387)#11,766 |
| 3. | 29732 | 0.98% | 1.8%(-0.778)#212 | 2.1%(-1.10)#17,103 |
1
Common Questions
What are the Top Zip Codes with the Highest Percentage of Population Employed in Arts, Entertainment & Recreation in Rock Hill, SC?
Top Zip Codes with the Highest Percentage of Population Employed in Arts, Entertainment & Recreation in Rock Hill, SC are:
What zip code has the Highest Percentage of Population Employed in Arts, Entertainment & Recreation in Rock Hill, SC?
29733 has the Highest Percentage of Population Employed in Arts, Entertainment & Recreation in Rock Hill, SC with 9.4%.
What is the Percentage of Population Employed in Arts, Entertainment & Recreation in Rock Hill, SC?
Percentage of Population Employed in Arts, Entertainment & Recreation in Rock Hill is 1.6%.
What is the Percentage of Population Employed in Arts, Entertainment & Recreation in South Carolina?
Percentage of Population Employed in Arts, Entertainment & Recreation in South Carolina is 1.8%.
What is the Percentage of Population Employed in Arts, Entertainment & Recreation in the United States?
Percentage of Population Employed in Arts, Entertainment & Recreation in the United States is 2.1%.