Zip Codes with the Highest Percentage of Owner-Occupied Units in Orangeburg, SC
RELATED REPORTS & OPTIONS
Highest Owner-Occupied
Orangeburg
Compare Zip Codes
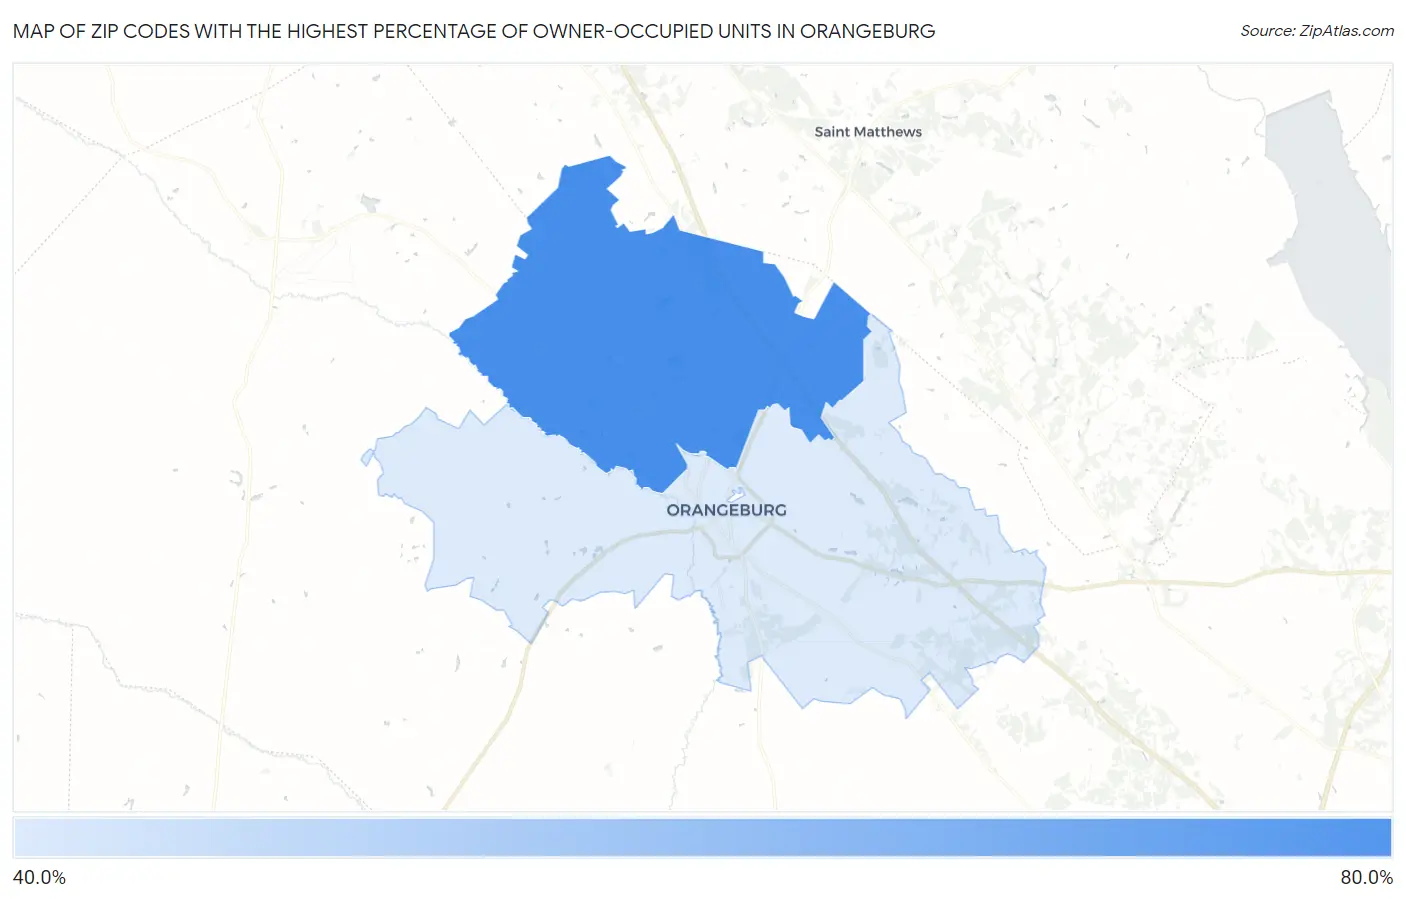
Map of Zip Codes with the Highest Percentage of Owner-Occupied Units in Orangeburg
0.0%
80.0%
Zip Codes with the Highest Percentage of Owner-Occupied Units in Orangeburg, SC
| Zip Code | % Owner-Occupied | vs State | vs National | |
| 1. | 29118 | 64.8% | 70.9%(-6.11)#322 | 64.8%(-0.011)#25,566 |
| 2. | 29115 | 49.7% | 70.9%(-21.2)#381 | 64.8%(-15.1)#29,785 |
1
Common Questions
What are the Top Zip Codes with the Highest Percentage of Owner-Occupied Units in Orangeburg, SC?
Top Zip Codes with the Highest Percentage of Owner-Occupied Units in Orangeburg, SC are:
What zip code has the Highest Percentage of Owner-Occupied Units in Orangeburg, SC?
29118 has the Highest Percentage of Owner-Occupied Units in Orangeburg, SC with 64.8%.
What is the Percentage of Owner-Occupied Units in Orangeburg, SC?
Percentage of Owner-Occupied Units in Orangeburg is 45.4%.
What is the Percentage of Owner-Occupied Units in South Carolina?
Percentage of Owner-Occupied Units in South Carolina is 70.9%.
What is the Percentage of Owner-Occupied Units in the United States?
Percentage of Owner-Occupied Units in the United States is 64.8%.