Zip Codes with the Highest Percentage of Population Employed in Farming, Fishing & Forestry in Orangeburg, SC
RELATED REPORTS & OPTIONS
Select to Compare
Select to Compare
Compare Zip Codes
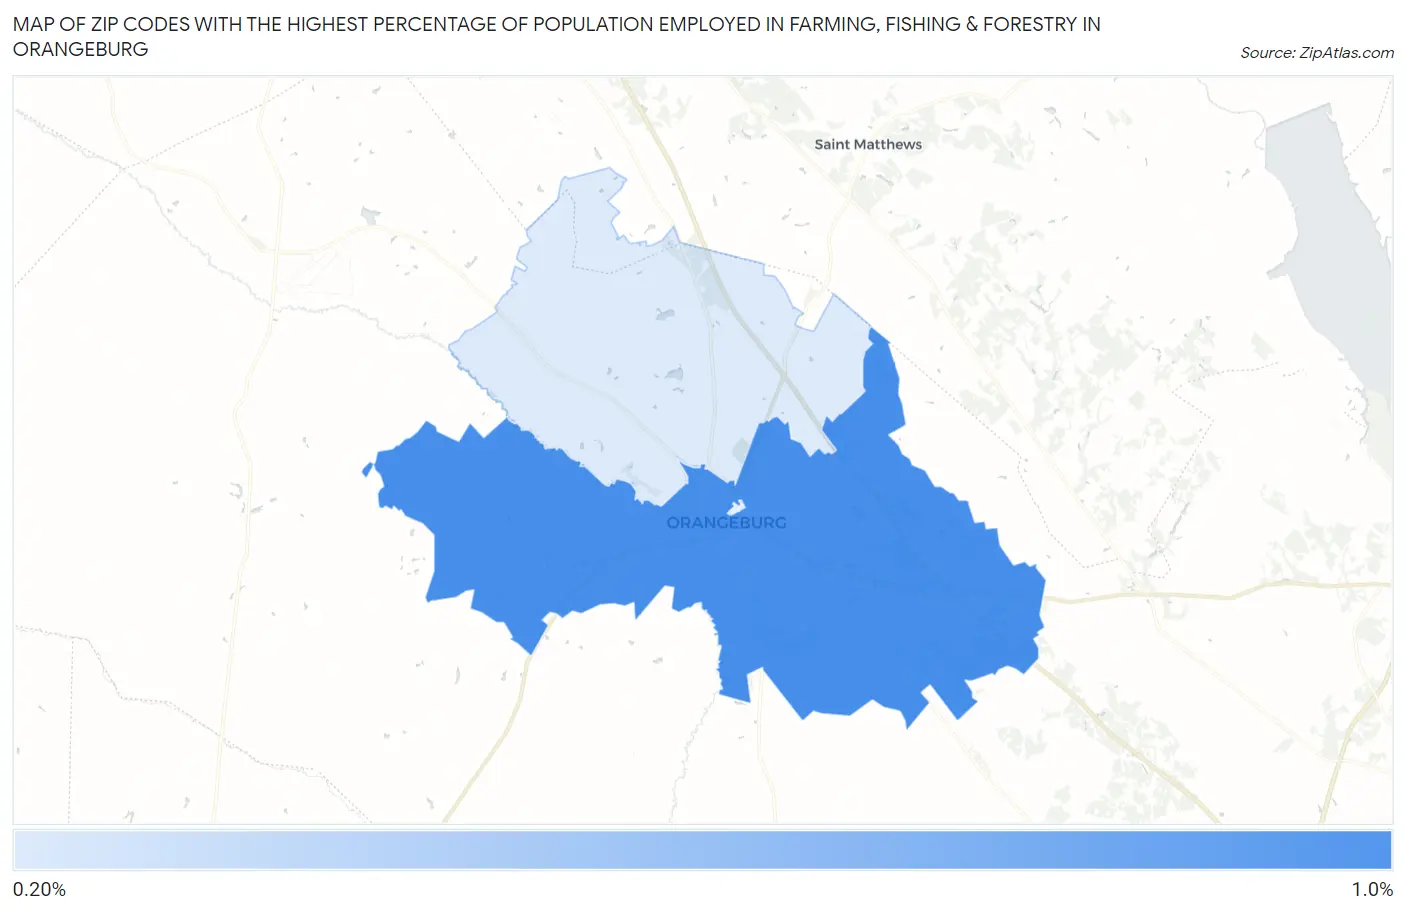
Map of Zip Codes with the Highest Percentage of Population Employed in Farming, Fishing & Forestry in Orangeburg
0.0%
0.80%
Zip Codes with the Highest Percentage of Population Employed in Farming, Fishing & Forestry in Orangeburg, SC
| Zip Code | % Employed | vs State | vs National | |
| 1. | 29115 | 0.65% | 0.39%(+0.266)#105 | 0.61%(+0.048)#11,672 |
1
Common Questions
What are the Top Zip Codes with the Highest Percentage of Population Employed in Farming, Fishing & Forestry in Orangeburg, SC?
Top Zip Codes with the Highest Percentage of Population Employed in Farming, Fishing & Forestry in Orangeburg, SC are:
What zip code has the Highest Percentage of Population Employed in Farming, Fishing & Forestry in Orangeburg, SC?
29115 has the Highest Percentage of Population Employed in Farming, Fishing & Forestry in Orangeburg, SC with 0.65%.
What is the Percentage of Population Employed in Farming, Fishing & Forestry in South Carolina?
Percentage of Population Employed in Farming, Fishing & Forestry in South Carolina is 0.39%.
What is the Percentage of Population Employed in Farming, Fishing & Forestry in the United States?
Percentage of Population Employed in Farming, Fishing & Forestry in the United States is 0.61%.