Zip Codes with the Highest Percentage of Owner-Occupied Units in North Charleston, SC
RELATED REPORTS & OPTIONS
Highest Owner-Occupied
North Charleston
Compare Zip Codes
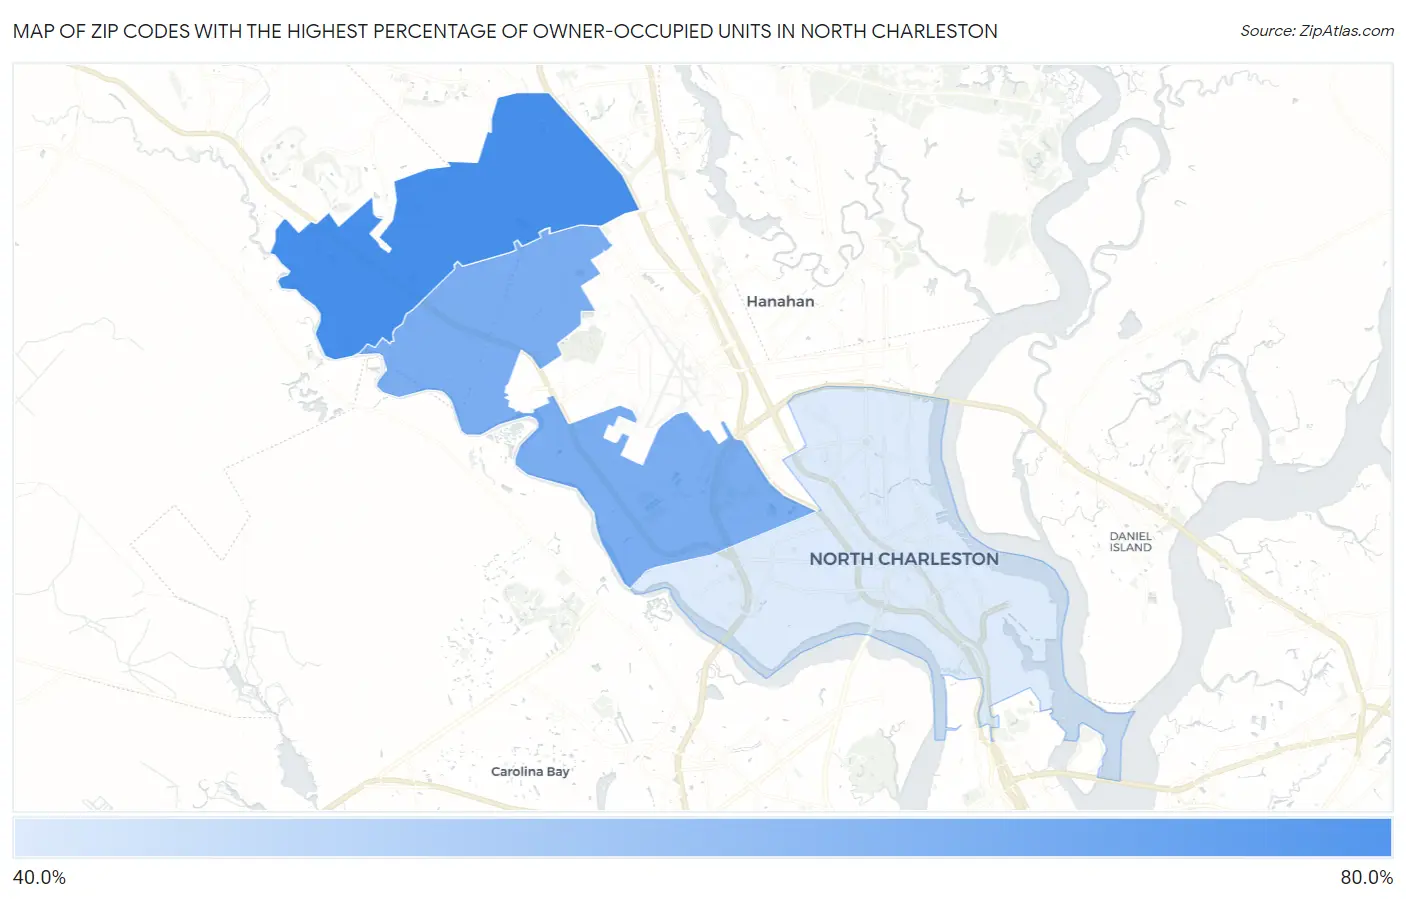
Map of Zip Codes with the Highest Percentage of Owner-Occupied Units in North Charleston
0.0%
80.0%
Zip Codes with the Highest Percentage of Owner-Occupied Units in North Charleston, SC
| Zip Code | % Owner-Occupied | vs State | vs National | |
| 1. | 29420 | 62.1% | 70.9%(-8.79)#341 | 64.8%(-2.69)#26,680 |
| 2. | 29418 | 56.6% | 70.9%(-14.3)#365 | 64.8%(-8.19)#28,345 |
| 3. | 29405 | 46.1% | 70.9%(-24.9)#389 | 64.8%(-18.8)#30,336 |
1
Common Questions
What are the Top Zip Codes with the Highest Percentage of Owner-Occupied Units in North Charleston, SC?
Top Zip Codes with the Highest Percentage of Owner-Occupied Units in North Charleston, SC are:
What zip code has the Highest Percentage of Owner-Occupied Units in North Charleston, SC?
29420 has the Highest Percentage of Owner-Occupied Units in North Charleston, SC with 62.1%.
What is the Percentage of Owner-Occupied Units in North Charleston, SC?
Percentage of Owner-Occupied Units in North Charleston is 49.4%.
What is the Percentage of Owner-Occupied Units in South Carolina?
Percentage of Owner-Occupied Units in South Carolina is 70.9%.
What is the Percentage of Owner-Occupied Units in the United States?
Percentage of Owner-Occupied Units in the United States is 64.8%.