Zip Codes with the Highest Percentage of Renter-Occupied Units in Greenwood, SC
RELATED REPORTS & OPTIONS
Highest Renter-Occupied
Greenwood
Compare Zip Codes
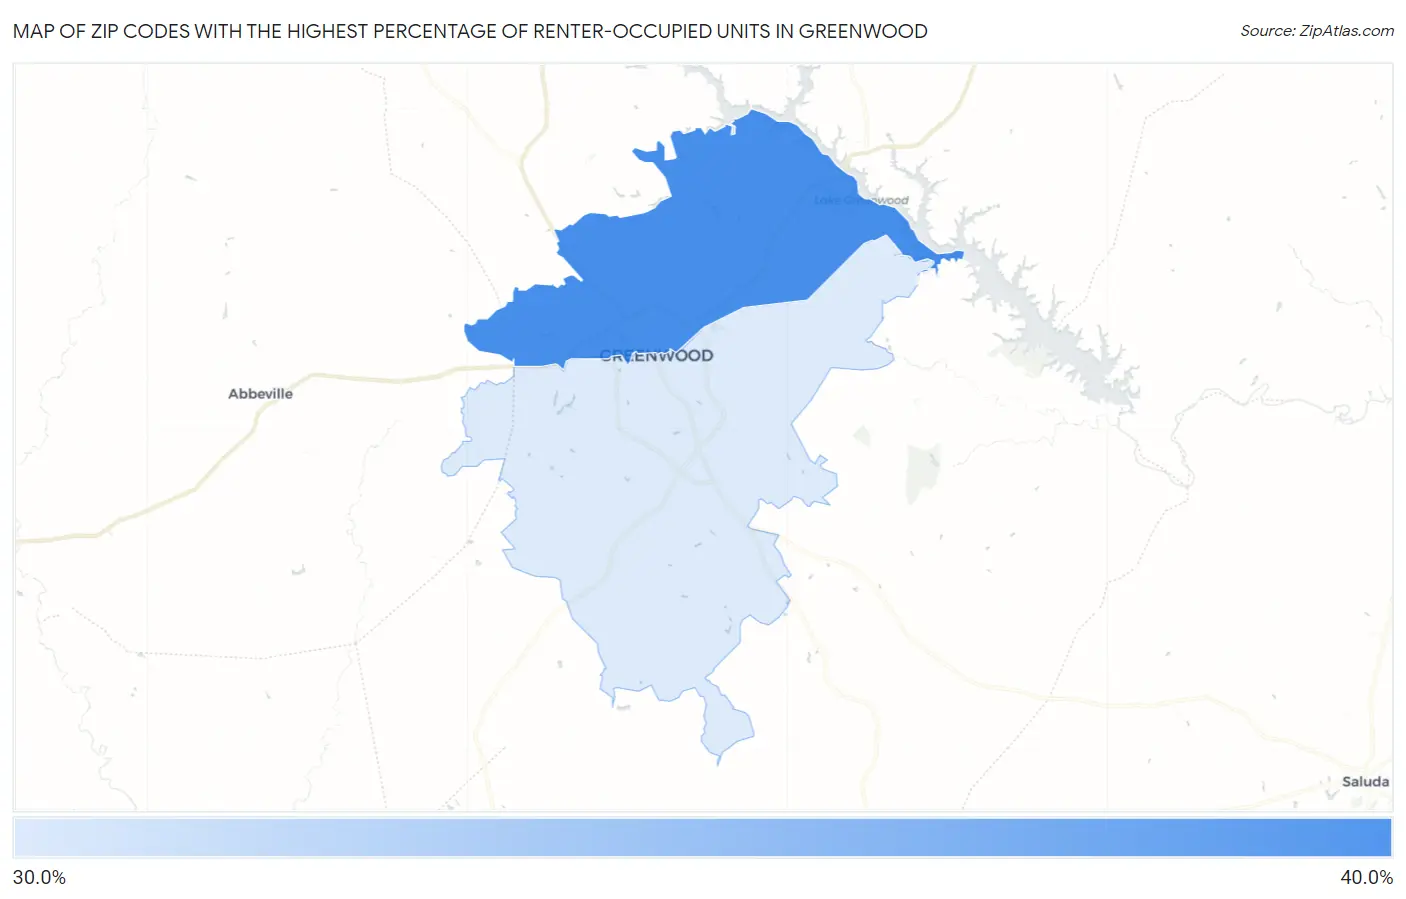
Map of Zip Codes with the Highest Percentage of Renter-Occupied Units in Greenwood
0.0%
40.0%
Zip Codes with the Highest Percentage of Renter-Occupied Units in Greenwood, SC
| Zip Code | % Renter-Occupied | vs State | vs National | |
| 1. | 29649 | 39.2% | 29.1%(+10.1)#65 | 35.2%(+4.04)#5,648 |
| 2. | 29646 | 38.3% | 29.1%(+9.22)#70 | 35.2%(+3.12)#5,986 |
1
Common Questions
What are the Top Zip Codes with the Highest Percentage of Renter-Occupied Units in Greenwood, SC?
Top Zip Codes with the Highest Percentage of Renter-Occupied Units in Greenwood, SC are:
What zip code has the Highest Percentage of Renter-Occupied Units in Greenwood, SC?
29649 has the Highest Percentage of Renter-Occupied Units in Greenwood, SC with 39.2%.
What is the Percentage of Renter-Occupied Units in Greenwood, SC?
Percentage of Renter-Occupied Units in Greenwood is 55.6%.
What is the Percentage of Renter-Occupied Units in South Carolina?
Percentage of Renter-Occupied Units in South Carolina is 29.1%.
What is the Percentage of Renter-Occupied Units in the United States?
Percentage of Renter-Occupied Units in the United States is 35.2%.