Zip Codes with the Highest Percentage of Population Employed in Arts, Entertainment & Recreation in Fort Mill, SC
RELATED REPORTS & OPTIONS
Arts, Entertainment & Recreation
Fort Mill
Compare Zip Codes
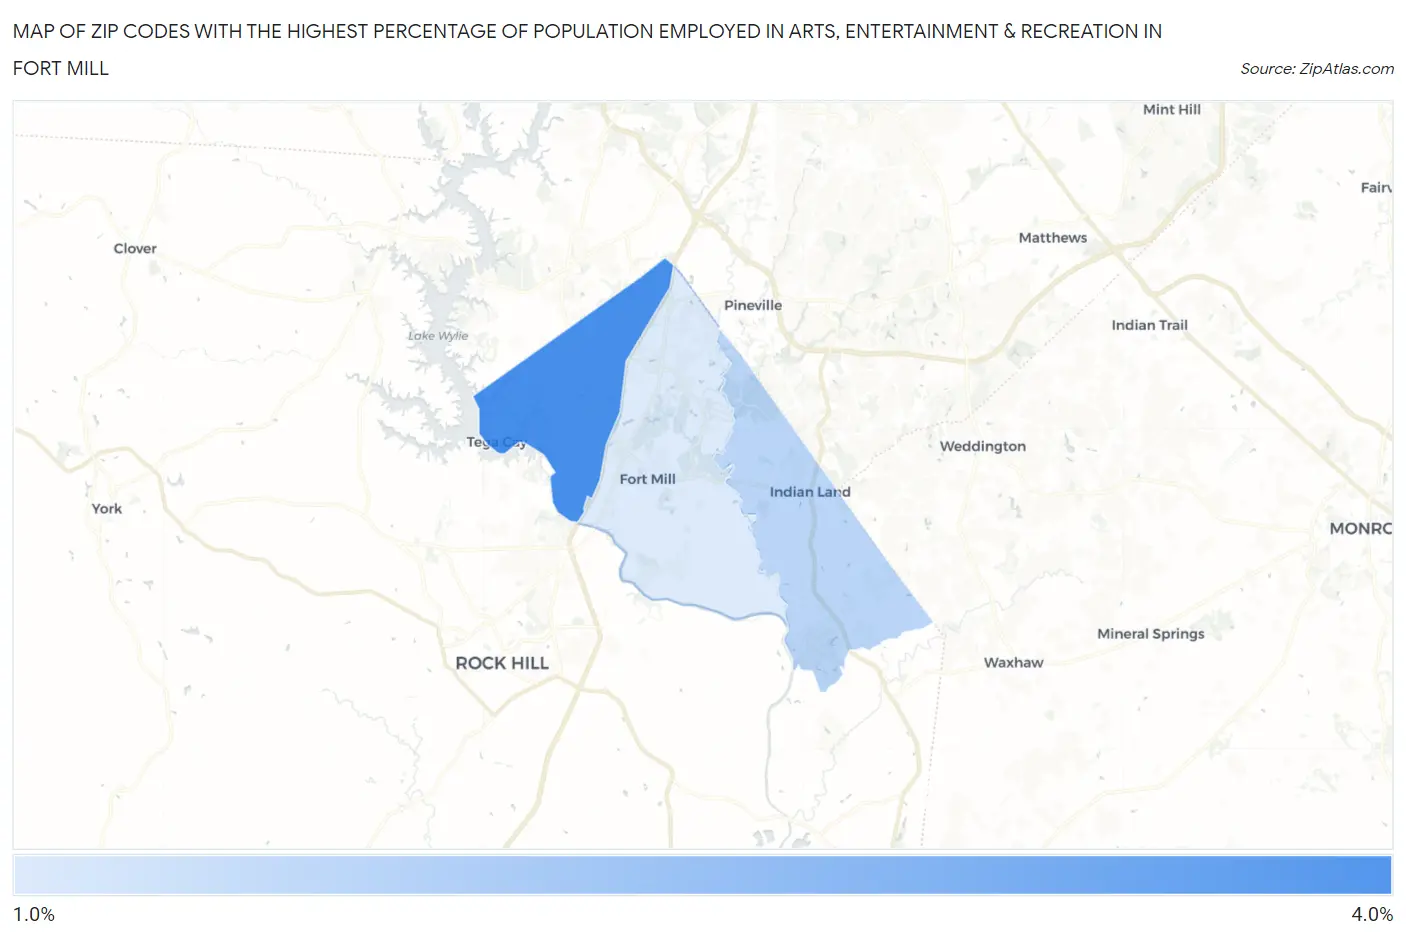
Map of Zip Codes with the Highest Percentage of Population Employed in Arts, Entertainment & Recreation in Fort Mill
0.0%
4.0%
Zip Codes with the Highest Percentage of Population Employed in Arts, Entertainment & Recreation in Fort Mill, SC
| Zip Code | % Employed | vs State | vs National | |
| 1. | 29708 | 3.4% | 1.8%(+1.64)#46 | 2.1%(+1.32)#4,355 |
| 2. | 29707 | 1.9% | 1.8%(+0.116)#107 | 2.1%(-0.206)#10,514 |
| 3. | 29715 | 1.4% | 1.8%(-0.326)#159 | 2.1%(-0.648)#13,730 |
1
Common Questions
What are the Top Zip Codes with the Highest Percentage of Population Employed in Arts, Entertainment & Recreation in Fort Mill, SC?
Top Zip Codes with the Highest Percentage of Population Employed in Arts, Entertainment & Recreation in Fort Mill, SC are:
What zip code has the Highest Percentage of Population Employed in Arts, Entertainment & Recreation in Fort Mill, SC?
29708 has the Highest Percentage of Population Employed in Arts, Entertainment & Recreation in Fort Mill, SC with 3.4%.
What is the Percentage of Population Employed in Arts, Entertainment & Recreation in Fort Mill, SC?
Percentage of Population Employed in Arts, Entertainment & Recreation in Fort Mill is 2.4%.
What is the Percentage of Population Employed in Arts, Entertainment & Recreation in South Carolina?
Percentage of Population Employed in Arts, Entertainment & Recreation in South Carolina is 1.8%.
What is the Percentage of Population Employed in Arts, Entertainment & Recreation in the United States?
Percentage of Population Employed in Arts, Entertainment & Recreation in the United States is 2.1%.