Cities with the Highest Percentage of Population Employed in Personal Care and Service in South Carolina
RELATED REPORTS & OPTIONS
Personal Care and Service
South Carolina
Compare Cities
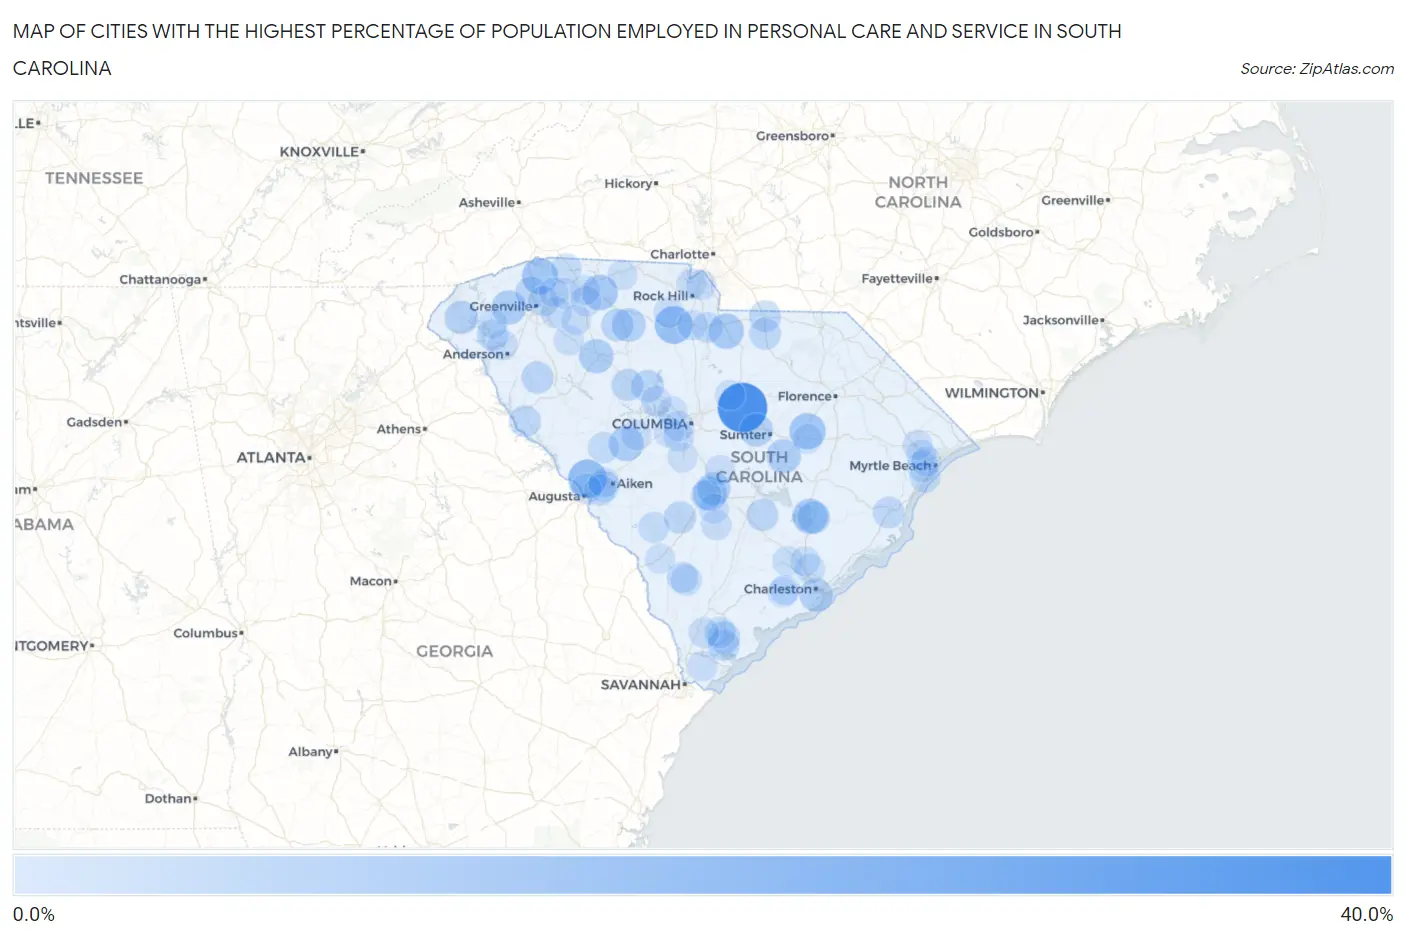
Map of Cities with the Highest Percentage of Population Employed in Personal Care and Service in South Carolina
0.0%
40.0%
Cities with the Highest Percentage of Population Employed in Personal Care and Service in South Carolina
| City | % Employed | vs State | vs National | |
| 1. | Boykin | 34.3% | 2.4%(+31.9)#1 | 2.6%(+31.8)#89 |
| 2. | Glenn Springs | 33.3% | 2.4%(+30.9)#2 | 2.6%(+30.8)#94 |
| 3. | Tradesville | 31.2% | 2.4%(+28.9)#3 | 2.6%(+28.7)#110 |
| 4. | Clemson University | 26.7% | 2.4%(+24.3)#4 | 2.6%(+24.2)#142 |
| 5. | Ashwood | 23.3% | 2.4%(+20.9)#5 | 2.6%(+20.8)#185 |
| 6. | Murphys Estates | 16.3% | 2.4%(+13.9)#6 | 2.6%(+13.7)#367 |
| 7. | Eureka Mill | 15.2% | 2.4%(+12.9)#7 | 2.6%(+12.7)#415 |
| 8. | Shiloh | 12.7% | 2.4%(+10.3)#8 | 2.6%(+10.1)#582 |
| 9. | Tigerville | 12.5% | 2.4%(+10.1)#9 | 2.6%(+9.97)#602 |
| 10. | Glendale | 11.7% | 2.4%(+9.27)#10 | 2.6%(+9.09)#697 |
| 11. | Elgin | 11.1% | 2.4%(+8.76)#11 | 2.6%(+8.59)#759 |
| 12. | Bonneau Beach | 10.9% | 2.4%(+8.47)#12 | 2.6%(+8.30)#803 |
| 13. | Monetta | 10.2% | 2.4%(+7.84)#13 | 2.6%(+7.66)#892 |
| 14. | Clinton | 9.8% | 2.4%(+7.37)#14 | 2.6%(+7.20)#973 |
| 15. | Arial | 9.8% | 2.4%(+7.37)#15 | 2.6%(+7.19)#974 |
| 16. | Orangeburg | 9.4% | 2.4%(+7.05)#16 | 2.6%(+6.88)#1,043 |
| 17. | Alcolu | 9.4% | 2.4%(+7.05)#17 | 2.6%(+6.87)#1,045 |
| 18. | Chickasaw Point | 9.2% | 2.4%(+6.80)#18 | 2.6%(+6.63)#1,099 |
| 19. | Monarch Mill | 8.7% | 2.4%(+6.29)#19 | 2.6%(+6.11)#1,242 |
| 20. | Brookdale | 8.4% | 2.4%(+6.02)#20 | 2.6%(+5.84)#1,311 |
| 21. | James Island | 8.4% | 2.4%(+5.98)#21 | 2.6%(+5.80)#1,318 |
| 22. | Walhalla | 8.3% | 2.4%(+5.88)#22 | 2.6%(+5.71)#1,355 |
| 23. | Cherryvale | 8.1% | 2.4%(+5.73)#23 | 2.6%(+5.56)#1,395 |
| 24. | Pomaria | 7.0% | 2.4%(+4.59)#24 | 2.6%(+4.41)#1,841 |
| 25. | Bonneau | 6.9% | 2.4%(+4.53)#25 | 2.6%(+4.35)#1,877 |
| 26. | Burton | 6.9% | 2.4%(+4.47)#26 | 2.6%(+4.30)#1,906 |
| 27. | North Santee | 6.8% | 2.4%(+4.41)#27 | 2.6%(+4.24)#1,943 |
| 28. | Helena | 6.8% | 2.4%(+4.38)#28 | 2.6%(+4.21)#1,958 |
| 29. | Buffalo | 6.6% | 2.4%(+4.26)#29 | 2.6%(+4.09)#2,017 |
| 30. | Due West | 6.6% | 2.4%(+4.21)#30 | 2.6%(+4.04)#2,041 |
| 31. | Denmark | 6.4% | 2.4%(+3.99)#31 | 2.6%(+3.81)#2,182 |
| 32. | Newberry | 6.3% | 2.4%(+3.91)#32 | 2.6%(+3.73)#2,247 |
| 33. | Danwood | 6.2% | 2.4%(+3.84)#33 | 2.6%(+3.66)#2,311 |
| 34. | Travelers Rest | 6.2% | 2.4%(+3.76)#34 | 2.6%(+3.59)#2,362 |
| 35. | Holly Hill | 6.0% | 2.4%(+3.62)#35 | 2.6%(+3.44)#2,460 |
| 36. | Pageland | 6.0% | 2.4%(+3.57)#36 | 2.6%(+3.39)#2,498 |
| 37. | Buford | 5.8% | 2.4%(+3.43)#37 | 2.6%(+3.25)#2,620 |
| 38. | Jefferson | 5.8% | 2.4%(+3.41)#38 | 2.6%(+3.24)#2,639 |
| 39. | Georgetown | 5.8% | 2.4%(+3.39)#39 | 2.6%(+3.21)#2,662 |
| 40. | Mount Carmel | 5.7% | 2.4%(+3.27)#40 | 2.6%(+3.10)#2,767 |
| 41. | Whitney | 5.5% | 2.4%(+3.13)#41 | 2.6%(+2.96)#2,906 |
| 42. | Shell Point | 5.5% | 2.4%(+3.09)#42 | 2.6%(+2.91)#2,943 |
| 43. | Pendleton | 5.2% | 2.4%(+2.78)#43 | 2.6%(+2.60)#3,244 |
| 44. | Warrenville | 5.0% | 2.4%(+2.58)#44 | 2.6%(+2.40)#3,520 |
| 45. | Johnston | 4.9% | 2.4%(+2.54)#45 | 2.6%(+2.36)#3,560 |
| 46. | Dunbar | 4.9% | 2.4%(+2.52)#46 | 2.6%(+2.35)#3,585 |
| 47. | Laurel Bay | 4.8% | 2.4%(+2.36)#47 | 2.6%(+2.19)#3,787 |
| 48. | Barnwell | 4.7% | 2.4%(+2.31)#48 | 2.6%(+2.14)#3,848 |
| 49. | Capitol View | 4.7% | 2.4%(+2.29)#49 | 2.6%(+2.12)#3,884 |
| 50. | Varnville | 4.7% | 2.4%(+2.27)#50 | 2.6%(+2.10)#3,909 |
| 51. | Socastee | 4.6% | 2.4%(+2.25)#51 | 2.6%(+2.08)#3,937 |
| 52. | Langley | 4.6% | 2.4%(+2.25)#52 | 2.6%(+2.07)#3,944 |
| 53. | Hampton | 4.6% | 2.4%(+2.25)#53 | 2.6%(+2.07)#3,948 |
| 54. | Litchfield Beach | 4.6% | 2.4%(+2.21)#54 | 2.6%(+2.03)#3,997 |
| 55. | Fort Lawn | 4.6% | 2.4%(+2.17)#55 | 2.6%(+1.99)#4,072 |
| 56. | Five Forks | 4.5% | 2.4%(+2.14)#56 | 2.6%(+1.96)#4,131 |
| 57. | Duncan | 4.4% | 2.4%(+1.99)#57 | 2.6%(+1.82)#4,354 |
| 58. | North Augusta | 4.2% | 2.4%(+1.85)#58 | 2.6%(+1.67)#4,593 |
| 59. | Ridgeland | 4.2% | 2.4%(+1.80)#59 | 2.6%(+1.63)#4,686 |
| 60. | Campobello | 4.1% | 2.4%(+1.75)#60 | 2.6%(+1.58)#4,787 |
| 61. | Surfside Beach | 4.1% | 2.4%(+1.75)#61 | 2.6%(+1.57)#4,790 |
| 62. | Wade Hampton | 4.1% | 2.4%(+1.71)#62 | 2.6%(+1.53)#4,866 |
| 63. | White Knoll | 4.0% | 2.4%(+1.63)#63 | 2.6%(+1.45)#5,016 |
| 64. | Chapin | 4.0% | 2.4%(+1.59)#64 | 2.6%(+1.41)#5,109 |
| 65. | Ben Avon | 3.9% | 2.4%(+1.52)#65 | 2.6%(+1.35)#5,230 |
| 66. | Edisto | 3.9% | 2.4%(+1.52)#66 | 2.6%(+1.35)#5,243 |
| 67. | South Congaree | 3.9% | 2.4%(+1.51)#67 | 2.6%(+1.34)#5,265 |
| 68. | Oak Grove | 3.9% | 2.4%(+1.48)#68 | 2.6%(+1.30)#5,347 |
| 69. | Gray Court | 3.8% | 2.4%(+1.45)#69 | 2.6%(+1.27)#5,443 |
| 70. | Batesburg Leesville | 3.8% | 2.4%(+1.44)#70 | 2.6%(+1.26)#5,457 |
| 71. | Northlake | 3.8% | 2.4%(+1.41)#71 | 2.6%(+1.23)#5,525 |
| 72. | Lowrys | 3.7% | 2.4%(+1.32)#72 | 2.6%(+1.14)#5,751 |
| 73. | Graniteville | 3.7% | 2.4%(+1.29)#73 | 2.6%(+1.12)#5,826 |
| 74. | Richburg | 3.6% | 2.4%(+1.26)#74 | 2.6%(+1.09)#5,911 |
| 75. | Roebuck | 3.6% | 2.4%(+1.25)#75 | 2.6%(+1.07)#5,940 |
| 76. | Branchville | 3.6% | 2.4%(+1.18)#76 | 2.6%(+1.00)#6,165 |
| 77. | India Hook | 3.5% | 2.4%(+1.15)#77 | 2.6%(+0.980)#6,220 |
| 78. | Bluffton | 3.5% | 2.4%(+1.14)#78 | 2.6%(+0.970)#6,258 |
| 79. | Summerville | 3.5% | 2.4%(+1.09)#79 | 2.6%(+0.917)#6,416 |
| 80. | Woodruff | 3.5% | 2.4%(+1.09)#80 | 2.6%(+0.915)#6,424 |
| 81. | Hollywood | 3.5% | 2.4%(+1.08)#81 | 2.6%(+0.907)#6,443 |
| 82. | Red Hill | 3.5% | 2.4%(+1.07)#82 | 2.6%(+0.893)#6,481 |
| 83. | Fort Mill | 3.4% | 2.4%(+1.02)#83 | 2.6%(+0.844)#6,632 |
| 84. | St Matthews | 3.4% | 2.4%(+1.01)#84 | 2.6%(+0.838)#6,660 |
| 85. | Hanahan | 3.4% | 2.4%(+0.991)#85 | 2.6%(+0.816)#6,726 |
| 86. | Rowesville | 3.4% | 2.4%(+0.990)#86 | 2.6%(+0.816)#6,729 |
| 87. | Saxon | 3.4% | 2.4%(+0.981)#87 | 2.6%(+0.807)#6,765 |
| 88. | Ravenel | 3.4% | 2.4%(+0.969)#88 | 2.6%(+0.795)#6,806 |
| 89. | Red Bank | 3.3% | 2.4%(+0.957)#89 | 2.6%(+0.783)#6,845 |
| 90. | Greer | 3.3% | 2.4%(+0.957)#90 | 2.6%(+0.782)#6,851 |
| 91. | Lugoff | 3.3% | 2.4%(+0.951)#91 | 2.6%(+0.777)#6,862 |
| 92. | Gaffney | 3.3% | 2.4%(+0.943)#92 | 2.6%(+0.768)#6,910 |
| 93. | Central | 3.3% | 2.4%(+0.915)#93 | 2.6%(+0.741)#6,992 |
| 94. | Conway | 3.3% | 2.4%(+0.915)#94 | 2.6%(+0.741)#6,993 |
| 95. | Irmo | 3.3% | 2.4%(+0.894)#95 | 2.6%(+0.720)#7,051 |
| 96. | Allendale | 3.3% | 2.4%(+0.871)#96 | 2.6%(+0.697)#7,134 |
| 97. | Goose Creek | 3.2% | 2.4%(+0.852)#97 | 2.6%(+0.678)#7,187 |
| 98. | Forestbrook | 3.2% | 2.4%(+0.781)#98 | 2.6%(+0.606)#7,441 |
| 99. | Swansea | 3.2% | 2.4%(+0.764)#99 | 2.6%(+0.589)#7,492 |
| 100. | Turbeville | 3.1% | 2.4%(+0.723)#100 | 2.6%(+0.549)#7,648 |
Common Questions
What are the Top 10 Cities with the Highest Percentage of Population Employed in Personal Care and Service in South Carolina?
Top 10 Cities with the Highest Percentage of Population Employed in Personal Care and Service in South Carolina are:
#1
34.3%
#2
16.3%
#3
15.2%
#4
12.7%
#5
12.5%
#6
11.7%
#7
11.1%
#8
10.9%
#9
10.2%
#10
9.8%
What city has the Highest Percentage of Population Employed in Personal Care and Service in South Carolina?
Boykin has the Highest Percentage of Population Employed in Personal Care and Service in South Carolina with 34.3%.
What is the Percentage of Population Employed in Personal Care and Service in the State of South Carolina?
Percentage of Population Employed in Personal Care and Service in South Carolina is 2.4%.
What is the Percentage of Population Employed in Personal Care and Service in the United States?
Percentage of Population Employed in Personal Care and Service in the United States is 2.6%.