Cities with the Highest Percentage of Population Employed in Transportation in South Carolina
RELATED REPORTS & OPTIONS
Transportation
South Carolina
Compare Cities
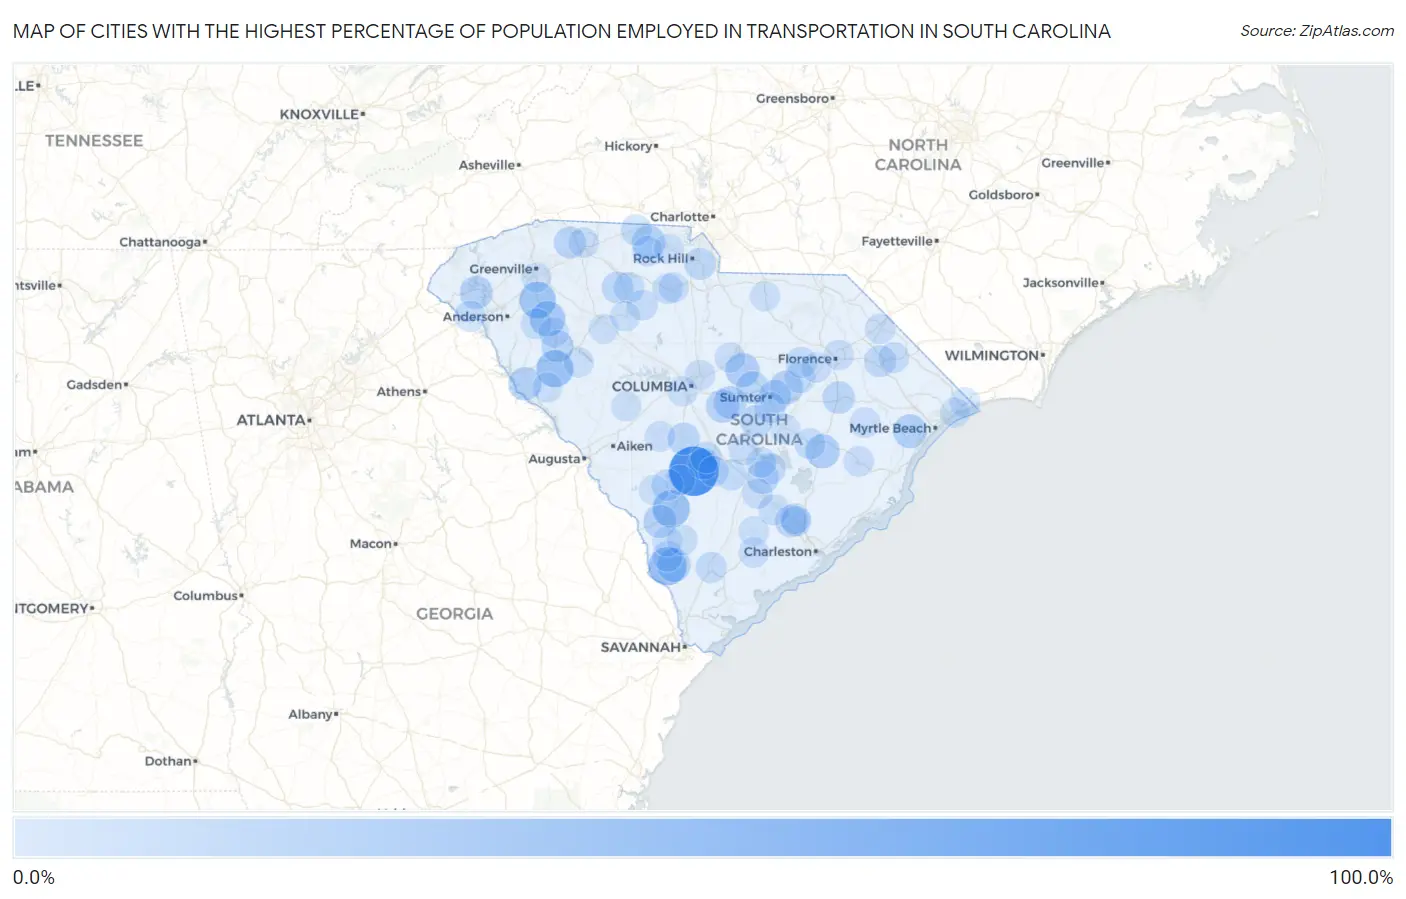
Map of Cities with the Highest Percentage of Population Employed in Transportation in South Carolina
0.0%
100.0%
Cities with the Highest Percentage of Population Employed in Transportation in South Carolina
| City | % Employed | vs State | vs National | |
| 1. | Cope | 81.8% | 3.7%(+78.1)#1 | 3.8%(+78.0)#28 |
| 2. | Ashwood | 43.3% | 3.7%(+39.6)#2 | 3.8%(+39.5)#146 |
| 3. | Sheldon | 38.3% | 3.7%(+34.5)#3 | 3.8%(+34.4)#187 |
| 4. | Scotia | 36.4% | 3.7%(+32.7)#4 | 3.8%(+32.5)#216 |
| 5. | Ulmer | 33.3% | 3.7%(+29.6)#5 | 3.8%(+29.5)#274 |
| 6. | Promised Land | 32.6% | 3.7%(+28.9)#6 | 3.8%(+28.8)#295 |
| 7. | Ware Place | 30.6% | 3.7%(+26.9)#7 | 3.8%(+26.8)#321 |
| 8. | Princeton | 26.4% | 3.7%(+22.7)#8 | 3.8%(+22.6)#439 |
| 9. | Seabrook | 22.8% | 3.7%(+19.1)#9 | 3.8%(+19.0)#596 |
| 10. | Boykin | 21.6% | 3.7%(+17.9)#10 | 3.8%(+17.8)#671 |
| 11. | Lane | 21.3% | 3.7%(+17.6)#11 | 3.8%(+17.5)#693 |
| 12. | Keowee Key | 20.8% | 3.7%(+17.1)#12 | 3.8%(+17.0)#725 |
| 13. | Bucksport | 20.8% | 3.7%(+17.1)#13 | 3.8%(+17.0)#733 |
| 14. | Furman | 20.7% | 3.7%(+17.0)#14 | 3.8%(+16.9)#736 |
| 15. | Smyrna | 20.0% | 3.7%(+16.3)#15 | 3.8%(+16.2)#808 |
| 16. | Mayesville | 19.4% | 3.7%(+15.7)#16 | 3.8%(+15.6)#847 |
| 17. | Mount Carmel | 18.9% | 3.7%(+15.2)#17 | 3.8%(+15.1)#888 |
| 18. | Little Rock | 18.8% | 3.7%(+15.0)#18 | 3.8%(+14.9)#896 |
| 19. | Allendale | 18.3% | 3.7%(+14.5)#19 | 3.8%(+14.4)#968 |
| 20. | Centenary | 17.8% | 3.7%(+14.1)#20 | 3.8%(+14.0)#1,030 |
| 21. | Gadsden | 17.6% | 3.7%(+13.9)#21 | 3.8%(+13.8)#1,050 |
| 22. | Utica | 17.5% | 3.7%(+13.8)#22 | 3.8%(+13.7)#1,060 |
| 23. | Eastover | 17.2% | 3.7%(+13.5)#23 | 3.8%(+13.4)#1,094 |
| 24. | Oakland | 15.5% | 3.7%(+11.8)#24 | 3.8%(+11.7)#1,328 |
| 25. | East Sumter | 15.4% | 3.7%(+11.7)#25 | 3.8%(+11.6)#1,342 |
| 26. | Holly Hill | 15.3% | 3.7%(+11.6)#26 | 3.8%(+11.5)#1,372 |
| 27. | Scranton | 15.0% | 3.7%(+11.2)#27 | 3.8%(+11.1)#1,438 |
| 28. | North | 14.5% | 3.7%(+10.8)#28 | 3.8%(+10.7)#1,540 |
| 29. | Lincolnville | 14.4% | 3.7%(+10.7)#29 | 3.8%(+10.6)#1,553 |
| 30. | Pinewood | 14.3% | 3.7%(+10.6)#30 | 3.8%(+10.5)#1,559 |
| 31. | Cokesbury | 14.2% | 3.7%(+10.5)#31 | 3.8%(+10.4)#1,597 |
| 32. | Inman Mills | 13.8% | 3.7%(+10.1)#32 | 3.8%(+9.99)#1,680 |
| 33. | Marion | 13.0% | 3.7%(+9.28)#33 | 3.8%(+9.17)#1,893 |
| 34. | Lesslie | 12.8% | 3.7%(+9.06)#34 | 3.8%(+8.95)#1,966 |
| 35. | Buffalo | 12.5% | 3.7%(+8.82)#35 | 3.8%(+8.71)#2,033 |
| 36. | Hilda | 12.1% | 3.7%(+8.37)#36 | 3.8%(+8.26)#2,197 |
| 37. | Cordova | 11.9% | 3.7%(+8.19)#37 | 3.8%(+8.09)#2,265 |
| 38. | Edisto | 11.8% | 3.7%(+8.13)#38 | 3.8%(+8.02)#2,293 |
| 39. | Hamer | 11.5% | 3.7%(+7.76)#39 | 3.8%(+7.65)#2,441 |
| 40. | Sandy Springs | 11.4% | 3.7%(+7.72)#40 | 3.8%(+7.61)#2,454 |
| 41. | Eutawville | 11.4% | 3.7%(+7.65)#41 | 3.8%(+7.55)#2,486 |
| 42. | Adams Run | 11.2% | 3.7%(+7.45)#42 | 3.8%(+7.34)#2,565 |
| 43. | Yemassee | 10.7% | 3.7%(+7.03)#43 | 3.8%(+6.92)#2,738 |
| 44. | Cash | 10.5% | 3.7%(+6.82)#44 | 3.8%(+6.71)#2,829 |
| 45. | Lynchburg | 10.5% | 3.7%(+6.82)#45 | 3.8%(+6.71)#2,833 |
| 46. | Lamar | 10.4% | 3.7%(+6.71)#46 | 3.8%(+6.60)#2,884 |
| 47. | Monarch Mill | 10.3% | 3.7%(+6.54)#47 | 3.8%(+6.44)#2,992 |
| 48. | Dale | 9.9% | 3.7%(+6.22)#48 | 3.8%(+6.12)#3,167 |
| 49. | Fair Play | 9.9% | 3.7%(+6.15)#49 | 3.8%(+6.04)#3,212 |
| 50. | Blacksburg | 9.7% | 3.7%(+5.98)#50 | 3.8%(+5.88)#3,319 |
| 51. | Bowman | 9.7% | 3.7%(+5.98)#51 | 3.8%(+5.88)#3,320 |
| 52. | Greeleyville | 9.7% | 3.7%(+5.94)#52 | 3.8%(+5.84)#3,339 |
| 53. | Lakewood | 9.6% | 3.7%(+5.88)#53 | 3.8%(+5.77)#3,392 |
| 54. | Ridgeville | 9.4% | 3.7%(+5.65)#54 | 3.8%(+5.54)#3,538 |
| 55. | Honea Path | 9.0% | 3.7%(+5.27)#55 | 3.8%(+5.17)#3,839 |
| 56. | Dunbar | 8.9% | 3.7%(+5.18)#56 | 3.8%(+5.08)#3,904 |
| 57. | Sangaree | 8.8% | 3.7%(+5.05)#57 | 3.8%(+4.94)#4,020 |
| 58. | Mullins | 8.7% | 3.7%(+5.03)#58 | 3.8%(+4.92)#4,043 |
| 59. | Conestee | 8.5% | 3.7%(+4.83)#59 | 3.8%(+4.72)#4,227 |
| 60. | Carlisle | 8.4% | 3.7%(+4.72)#60 | 3.8%(+4.62)#4,322 |
| 61. | Gayle Mill | 8.4% | 3.7%(+4.70)#61 | 3.8%(+4.59)#4,352 |
| 62. | Estill | 8.3% | 3.7%(+4.63)#62 | 3.8%(+4.53)#4,406 |
| 63. | Hickory Grove | 8.1% | 3.7%(+4.34)#63 | 3.8%(+4.23)#4,716 |
| 64. | Harleyville | 8.0% | 3.7%(+4.31)#64 | 3.8%(+4.20)#4,743 |
| 65. | Perry | 8.0% | 3.7%(+4.25)#65 | 3.8%(+4.15)#4,795 |
| 66. | Elloree | 7.9% | 3.7%(+4.20)#66 | 3.8%(+4.09)#4,845 |
| 67. | Vance | 7.8% | 3.7%(+4.13)#67 | 3.8%(+4.03)#4,911 |
| 68. | Stuckey | 7.8% | 3.7%(+4.11)#68 | 3.8%(+4.01)#4,932 |
| 69. | Boiling Springs | 7.8% | 3.7%(+4.04)#69 | 3.8%(+3.94)#5,013 |
| 70. | Hampton | 7.7% | 3.7%(+4.01)#70 | 3.8%(+3.90)#5,050 |
| 71. | Eureka Mill | 7.6% | 3.7%(+3.91)#71 | 3.8%(+3.80)#5,181 |
| 72. | Timmonsville | 7.6% | 3.7%(+3.85)#72 | 3.8%(+3.74)#5,245 |
| 73. | Andrews | 7.4% | 3.7%(+3.73)#73 | 3.8%(+3.62)#5,384 |
| 74. | Rowesville | 7.4% | 3.7%(+3.72)#74 | 3.8%(+3.62)#5,394 |
| 75. | Jacksonboro | 7.4% | 3.7%(+3.70)#75 | 3.8%(+3.59)#5,431 |
| 76. | Dillon | 7.4% | 3.7%(+3.68)#76 | 3.8%(+3.57)#5,463 |
| 77. | Dentsville | 7.3% | 3.7%(+3.57)#77 | 3.8%(+3.47)#5,592 |
| 78. | Lugoff | 7.3% | 3.7%(+3.57)#78 | 3.8%(+3.46)#5,596 |
| 79. | Quinby | 7.3% | 3.7%(+3.57)#79 | 3.8%(+3.46)#5,598 |
| 80. | Ladson | 7.1% | 3.7%(+3.44)#80 | 3.8%(+3.33)#5,752 |
| 81. | Ware Shoals | 7.1% | 3.7%(+3.41)#81 | 3.8%(+3.30)#5,826 |
| 82. | Denmark | 7.0% | 3.7%(+3.32)#82 | 3.8%(+3.22)#5,927 |
| 83. | Gifford | 7.0% | 3.7%(+3.27)#83 | 3.8%(+3.16)#5,991 |
| 84. | Dovesville | 7.0% | 3.7%(+3.26)#84 | 3.8%(+3.15)#6,005 |
| 85. | Barnwell | 6.9% | 3.7%(+3.19)#85 | 3.8%(+3.09)#6,101 |
| 86. | Little River | 6.9% | 3.7%(+3.17)#86 | 3.8%(+3.06)#6,149 |
| 87. | Manning | 6.9% | 3.7%(+3.15)#87 | 3.8%(+3.05)#6,164 |
| 88. | Joanna | 6.9% | 3.7%(+3.15)#88 | 3.8%(+3.04)#6,177 |
| 89. | Monetta | 6.8% | 3.7%(+3.11)#89 | 3.8%(+3.00)#6,244 |
| 90. | Newtown | 6.8% | 3.7%(+3.04)#90 | 3.8%(+2.93)#6,336 |
| 91. | Cottageville | 6.7% | 3.7%(+3.00)#91 | 3.8%(+2.90)#6,395 |
| 92. | Springdale | 6.6% | 3.7%(+2.89)#92 | 3.8%(+2.78)#6,581 |
| 93. | York | 6.5% | 3.7%(+2.79)#93 | 3.8%(+2.69)#6,720 |
| 94. | Whitmire | 6.5% | 3.7%(+2.78)#94 | 3.8%(+2.68)#6,729 |
| 95. | Chickasaw Point | 6.5% | 3.7%(+2.78)#95 | 3.8%(+2.67)#6,744 |
| 96. | Gantt | 6.5% | 3.7%(+2.77)#96 | 3.8%(+2.66)#6,760 |
| 97. | Ninety Six | 6.4% | 3.7%(+2.71)#97 | 3.8%(+2.61)#6,846 |
| 98. | Atlantic Beach | 6.4% | 3.7%(+2.68)#98 | 3.8%(+2.58)#6,890 |
| 99. | Jefferson | 6.4% | 3.7%(+2.64)#99 | 3.8%(+2.54)#6,966 |
| 100. | Troy | 6.3% | 3.7%(+2.64)#100 | 3.8%(+2.53)#6,983 |
Common Questions
What are the Top 10 Cities with the Highest Percentage of Population Employed in Transportation in South Carolina?
Top 10 Cities with the Highest Percentage of Population Employed in Transportation in South Carolina are:
#1
81.8%
#2
36.4%
#3
33.3%
#4
32.6%
#5
30.6%
#6
26.4%
#7
21.6%
#8
21.3%
#9
20.8%
#10
20.7%
What city has the Highest Percentage of Population Employed in Transportation in South Carolina?
Cope has the Highest Percentage of Population Employed in Transportation in South Carolina with 81.8%.
What is the Percentage of Population Employed in Transportation in the State of South Carolina?
Percentage of Population Employed in Transportation in South Carolina is 3.7%.
What is the Percentage of Population Employed in Transportation in the United States?
Percentage of Population Employed in Transportation in the United States is 3.8%.