Cities with the Highest Percentage of Population Employed in Agriculture, Fishing & Hunting in South Carolina
RELATED REPORTS & OPTIONS
Agriculture, Fishing & Hunting
South Carolina
Compare Cities
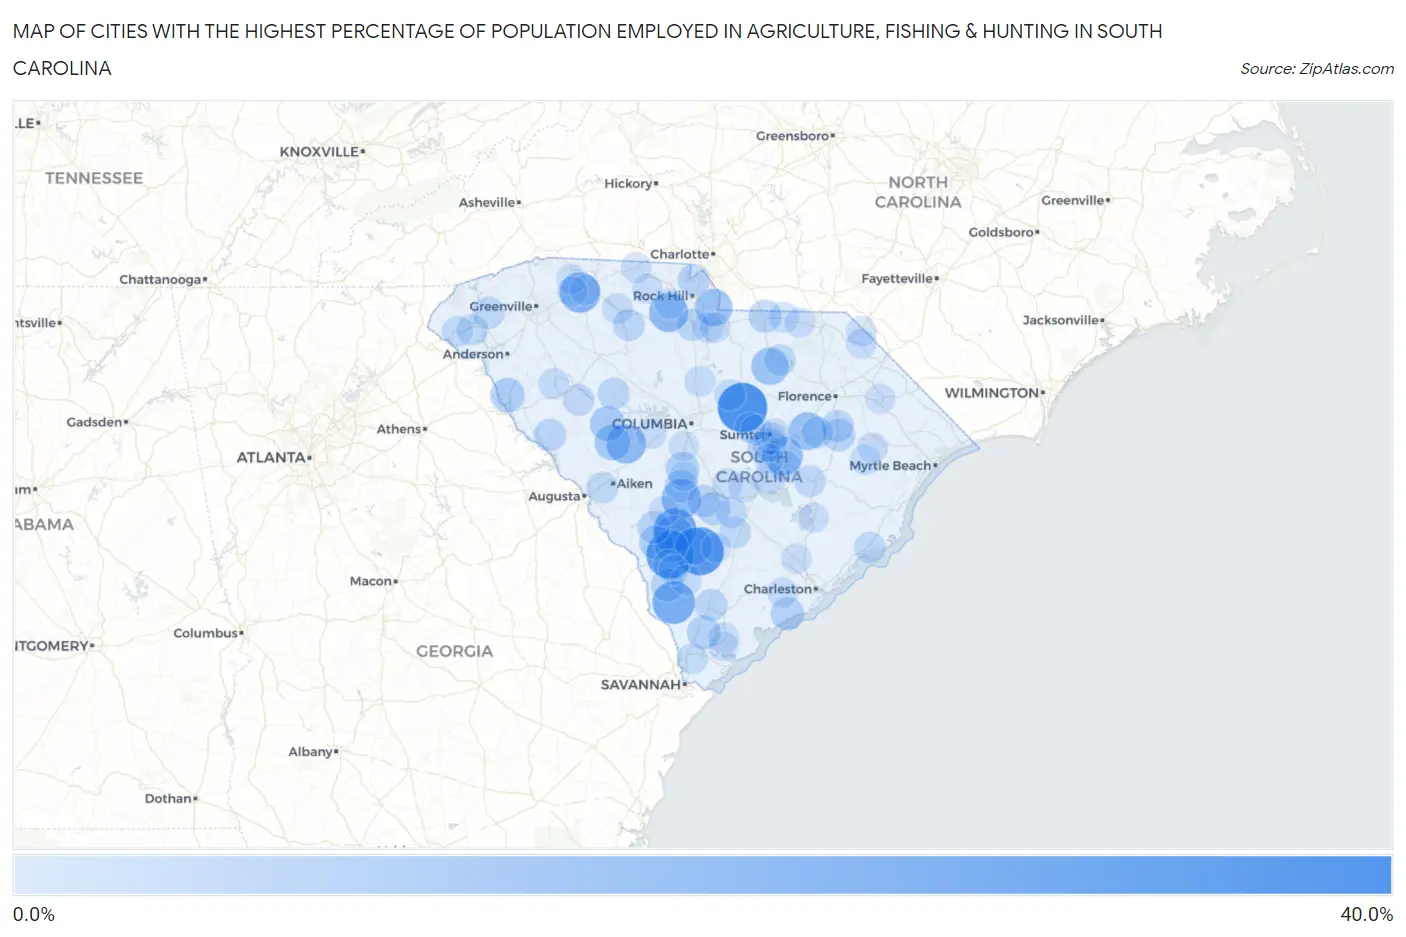
Map of Cities with the Highest Percentage of Population Employed in Agriculture, Fishing & Hunting in South Carolina
0.0%
40.0%
Cities with the Highest Percentage of Population Employed in Agriculture, Fishing & Hunting in South Carolina
| City | % Employed | vs State | vs National | |
| 1. | Boykin | 34.3% | 0.78%(+33.5)#1 | 1.2%(+33.1)#401 |
| 2. | Cash | 33.1% | 0.78%(+32.3)#2 | 1.2%(+31.9)#434 |
| 3. | Lodge | 31.4% | 0.78%(+30.7)#3 | 1.2%(+30.2)#479 |
| 4. | Sycamore | 30.4% | 0.78%(+29.7)#4 | 1.2%(+29.2)#522 |
| 5. | Govan | 23.3% | 0.78%(+22.6)#5 | 1.2%(+22.1)#804 |
| 6. | Furman | 22.6% | 0.78%(+21.8)#6 | 1.2%(+21.4)#836 |
| 7. | Fairforest | 18.9% | 0.78%(+18.1)#7 | 1.2%(+17.7)#1,093 |
| 8. | Monetta | 17.0% | 0.78%(+16.3)#8 | 1.2%(+15.8)#1,260 |
| 9. | Norway | 16.8% | 0.78%(+16.0)#9 | 1.2%(+15.6)#1,279 |
| 10. | Lowrys | 16.7% | 0.78%(+15.9)#10 | 1.2%(+15.5)#1,286 |
| 11. | Olar | 16.7% | 0.78%(+15.9)#11 | 1.2%(+15.5)#1,290 |
| 12. | Alcolu | 15.1% | 0.78%(+14.3)#12 | 1.2%(+13.9)#1,474 |
| 13. | Shiloh | 14.3% | 0.78%(+13.5)#13 | 1.2%(+13.1)#1,568 |
| 14. | Bethune | 13.5% | 0.78%(+12.7)#14 | 1.2%(+12.3)#1,667 |
| 15. | Van Wyck | 13.5% | 0.78%(+12.7)#15 | 1.2%(+12.3)#1,672 |
| 16. | Ehrhardt | 13.3% | 0.78%(+12.5)#16 | 1.2%(+12.1)#1,709 |
| 17. | Little Rock | 13.0% | 0.78%(+12.2)#17 | 1.2%(+11.8)#1,753 |
| 18. | Ward | 10.9% | 0.78%(+10.1)#18 | 1.2%(+9.71)#2,172 |
| 19. | Saluda | 10.0% | 0.78%(+9.18)#19 | 1.2%(+8.76)#2,450 |
| 20. | Dovesville | 9.0% | 0.78%(+8.24)#20 | 1.2%(+7.82)#2,767 |
| 21. | Dunbar | 8.9% | 0.78%(+8.12)#21 | 1.2%(+7.70)#2,802 |
| 22. | Kline | 8.6% | 0.78%(+7.79)#22 | 1.2%(+7.37)#2,928 |
| 23. | Lowndesville | 8.5% | 0.78%(+7.70)#23 | 1.2%(+7.28)#2,961 |
| 24. | Ridgeland | 7.8% | 0.78%(+7.03)#24 | 1.2%(+6.61)#3,211 |
| 25. | Hamer | 7.6% | 0.78%(+6.87)#25 | 1.2%(+6.45)#3,300 |
| 26. | Woodford | 7.5% | 0.78%(+6.68)#26 | 1.2%(+6.26)#3,383 |
| 27. | Rockville | 7.3% | 0.78%(+6.54)#27 | 1.2%(+6.12)#3,435 |
| 28. | Lakewood | 7.2% | 0.78%(+6.41)#28 | 1.2%(+5.99)#3,497 |
| 29. | Ulmer | 7.0% | 0.78%(+6.24)#29 | 1.2%(+5.82)#3,592 |
| 30. | Rowesville | 6.8% | 0.78%(+5.98)#30 | 1.2%(+5.56)#3,714 |
| 31. | Luray | 6.7% | 0.78%(+5.95)#31 | 1.2%(+5.53)#3,730 |
| 32. | Scranton | 6.5% | 0.78%(+5.67)#32 | 1.2%(+5.25)#3,865 |
| 33. | Neeses | 6.4% | 0.78%(+5.65)#33 | 1.2%(+5.23)#3,880 |
| 34. | Pageland | 6.4% | 0.78%(+5.65)#34 | 1.2%(+5.23)#3,882 |
| 35. | Privateer | 6.0% | 0.78%(+5.25)#35 | 1.2%(+4.83)#4,103 |
| 36. | Cordova | 6.0% | 0.78%(+5.17)#36 | 1.2%(+4.75)#4,148 |
| 37. | Barnwell | 5.8% | 0.78%(+5.06)#37 | 1.2%(+4.63)#4,223 |
| 38. | Tega Cay | 5.6% | 0.78%(+4.80)#38 | 1.2%(+4.37)#4,408 |
| 39. | Mccormick | 5.5% | 0.78%(+4.76)#39 | 1.2%(+4.34)#4,447 |
| 40. | Coward | 5.4% | 0.78%(+4.66)#40 | 1.2%(+4.24)#4,512 |
| 41. | Yemassee | 5.3% | 0.78%(+4.47)#41 | 1.2%(+4.05)#4,651 |
| 42. | Richburg | 5.1% | 0.78%(+4.33)#42 | 1.2%(+3.91)#4,758 |
| 43. | Silverstreet | 5.1% | 0.78%(+4.31)#43 | 1.2%(+3.89)#4,771 |
| 44. | South Sumter | 4.8% | 0.78%(+4.06)#44 | 1.2%(+3.64)#4,963 |
| 45. | Monarch Mill | 4.7% | 0.78%(+3.95)#45 | 1.2%(+3.53)#5,061 |
| 46. | Six Mile | 4.6% | 0.78%(+3.82)#46 | 1.2%(+3.40)#5,165 |
| 47. | Mcbee | 4.5% | 0.78%(+3.75)#47 | 1.2%(+3.33)#5,229 |
| 48. | Ninety Six | 4.4% | 0.78%(+3.63)#48 | 1.2%(+3.21)#5,340 |
| 49. | Summerton | 4.4% | 0.78%(+3.59)#49 | 1.2%(+3.17)#5,388 |
| 50. | Olanta | 4.3% | 0.78%(+3.55)#50 | 1.2%(+3.13)#5,441 |
| 51. | Reevesville | 4.3% | 0.78%(+3.53)#51 | 1.2%(+3.11)#5,464 |
| 52. | Manning | 4.3% | 0.78%(+3.50)#52 | 1.2%(+3.08)#5,490 |
| 53. | Mcclellanville | 4.2% | 0.78%(+3.40)#53 | 1.2%(+2.98)#5,572 |
| 54. | Greeleyville | 4.1% | 0.78%(+3.36)#54 | 1.2%(+2.94)#5,630 |
| 55. | Gloverville | 4.1% | 0.78%(+3.33)#55 | 1.2%(+2.91)#5,667 |
| 56. | Lugoff | 4.0% | 0.78%(+3.21)#56 | 1.2%(+2.79)#5,776 |
| 57. | Seneca | 3.8% | 0.78%(+2.98)#57 | 1.2%(+2.56)#6,044 |
| 58. | Westminster | 3.7% | 0.78%(+2.94)#58 | 1.2%(+2.52)#6,092 |
| 59. | Bowman | 3.6% | 0.78%(+2.79)#59 | 1.2%(+2.37)#6,284 |
| 60. | Hardeeville | 3.4% | 0.78%(+2.65)#60 | 1.2%(+2.23)#6,449 |
| 61. | Hodges | 3.4% | 0.78%(+2.61)#61 | 1.2%(+2.19)#6,502 |
| 62. | Fairfax | 3.4% | 0.78%(+2.57)#62 | 1.2%(+2.15)#6,556 |
| 63. | Cherryvale | 3.3% | 0.78%(+2.52)#63 | 1.2%(+2.10)#6,634 |
| 64. | Jonesville | 3.3% | 0.78%(+2.51)#64 | 1.2%(+2.09)#6,655 |
| 65. | Varnville | 3.1% | 0.78%(+2.37)#65 | 1.2%(+1.95)#6,831 |
| 66. | Ridgeway | 3.1% | 0.78%(+2.32)#66 | 1.2%(+1.90)#6,900 |
| 67. | Mount Croghan | 3.0% | 0.78%(+2.25)#67 | 1.2%(+1.83)#6,993 |
| 68. | Burton | 3.0% | 0.78%(+2.19)#68 | 1.2%(+1.77)#7,092 |
| 69. | Beech Island | 3.0% | 0.78%(+2.18)#69 | 1.2%(+1.76)#7,103 |
| 70. | Wyboo | 2.9% | 0.78%(+2.17)#70 | 1.2%(+1.75)#7,115 |
| 71. | Gilbert | 2.9% | 0.78%(+2.09)#71 | 1.2%(+1.67)#7,235 |
| 72. | Cameron | 2.8% | 0.78%(+2.07)#72 | 1.2%(+1.64)#7,282 |
| 73. | Blacksburg | 2.8% | 0.78%(+2.01)#73 | 1.2%(+1.59)#7,355 |
| 74. | Fort Lawn | 2.7% | 0.78%(+1.91)#74 | 1.2%(+1.49)#7,511 |
| 75. | Mccoll | 2.7% | 0.78%(+1.91)#75 | 1.2%(+1.48)#7,525 |
| 76. | Irwin | 2.6% | 0.78%(+1.87)#76 | 1.2%(+1.45)#7,574 |
| 77. | Stuckey | 2.6% | 0.78%(+1.83)#77 | 1.2%(+1.41)#7,658 |
| 78. | Hollywood | 2.6% | 0.78%(+1.78)#78 | 1.2%(+1.36)#7,744 |
| 79. | Hickory Grove | 2.5% | 0.78%(+1.76)#79 | 1.2%(+1.34)#7,767 |
| 80. | Mcconnells | 2.5% | 0.78%(+1.74)#80 | 1.2%(+1.32)#7,820 |
| 81. | Johnsonville | 2.5% | 0.78%(+1.69)#81 | 1.2%(+1.26)#7,911 |
| 82. | Stateburg | 2.5% | 0.78%(+1.67)#82 | 1.2%(+1.25)#7,923 |
| 83. | Inman | 2.4% | 0.78%(+1.65)#83 | 1.2%(+1.23)#7,967 |
| 84. | Ladson | 2.4% | 0.78%(+1.64)#84 | 1.2%(+1.22)#7,994 |
| 85. | Blackville | 2.4% | 0.78%(+1.58)#85 | 1.2%(+1.16)#8,122 |
| 86. | Elloree | 2.3% | 0.78%(+1.55)#86 | 1.2%(+1.13)#8,172 |
| 87. | Chesterfield | 2.3% | 0.78%(+1.51)#87 | 1.2%(+1.09)#8,233 |
| 88. | Marion | 2.3% | 0.78%(+1.51)#88 | 1.2%(+1.09)#8,236 |
| 89. | East Sumter | 2.2% | 0.78%(+1.47)#89 | 1.2%(+1.05)#8,338 |
| 90. | Saxon | 2.2% | 0.78%(+1.45)#90 | 1.2%(+1.03)#8,380 |
| 91. | Clio | 2.2% | 0.78%(+1.44)#91 | 1.2%(+1.01)#8,406 |
| 92. | Brunson | 2.2% | 0.78%(+1.42)#92 | 1.2%(+0.994)#8,448 |
| 93. | Bonneau | 2.1% | 0.78%(+1.35)#93 | 1.2%(+0.928)#8,587 |
| 94. | Gaston | 1.9% | 0.78%(+1.17)#94 | 1.2%(+0.744)#8,973 |
| 95. | Smoaks | 1.9% | 0.78%(+1.07)#95 | 1.2%(+0.652)#9,208 |
| 96. | Wellford | 1.8% | 0.78%(+1.07)#96 | 1.2%(+0.646)#9,223 |
| 97. | North | 1.8% | 0.78%(+0.997)#97 | 1.2%(+0.576)#9,370 |
| 98. | Daufuskie Island | 1.8% | 0.78%(+0.987)#98 | 1.2%(+0.565)#9,400 |
| 99. | Paxville | 1.8% | 0.78%(+0.987)#99 | 1.2%(+0.565)#9,402 |
| 100. | Port Royal | 1.6% | 0.78%(+0.861)#100 | 1.2%(+0.439)#9,734 |
Common Questions
What are the Top 10 Cities with the Highest Percentage of Population Employed in Agriculture, Fishing & Hunting in South Carolina?
Top 10 Cities with the Highest Percentage of Population Employed in Agriculture, Fishing & Hunting in South Carolina are:
What city has the Highest Percentage of Population Employed in Agriculture, Fishing & Hunting in South Carolina?
Boykin has the Highest Percentage of Population Employed in Agriculture, Fishing & Hunting in South Carolina with 34.3%.
What is the Percentage of Population Employed in Agriculture, Fishing & Hunting in the State of South Carolina?
Percentage of Population Employed in Agriculture, Fishing & Hunting in South Carolina is 0.78%.
What is the Percentage of Population Employed in Agriculture, Fishing & Hunting in the United States?
Percentage of Population Employed in Agriculture, Fishing & Hunting in the United States is 1.2%.