Zip Codes with the Highest Percentage of Households Heated by Bottled Gas / Liquid Propane in Charleston, SC
RELATED REPORTS & OPTIONS
Bottled Gas / LP Heating
Charleston
Compare Zip Codes
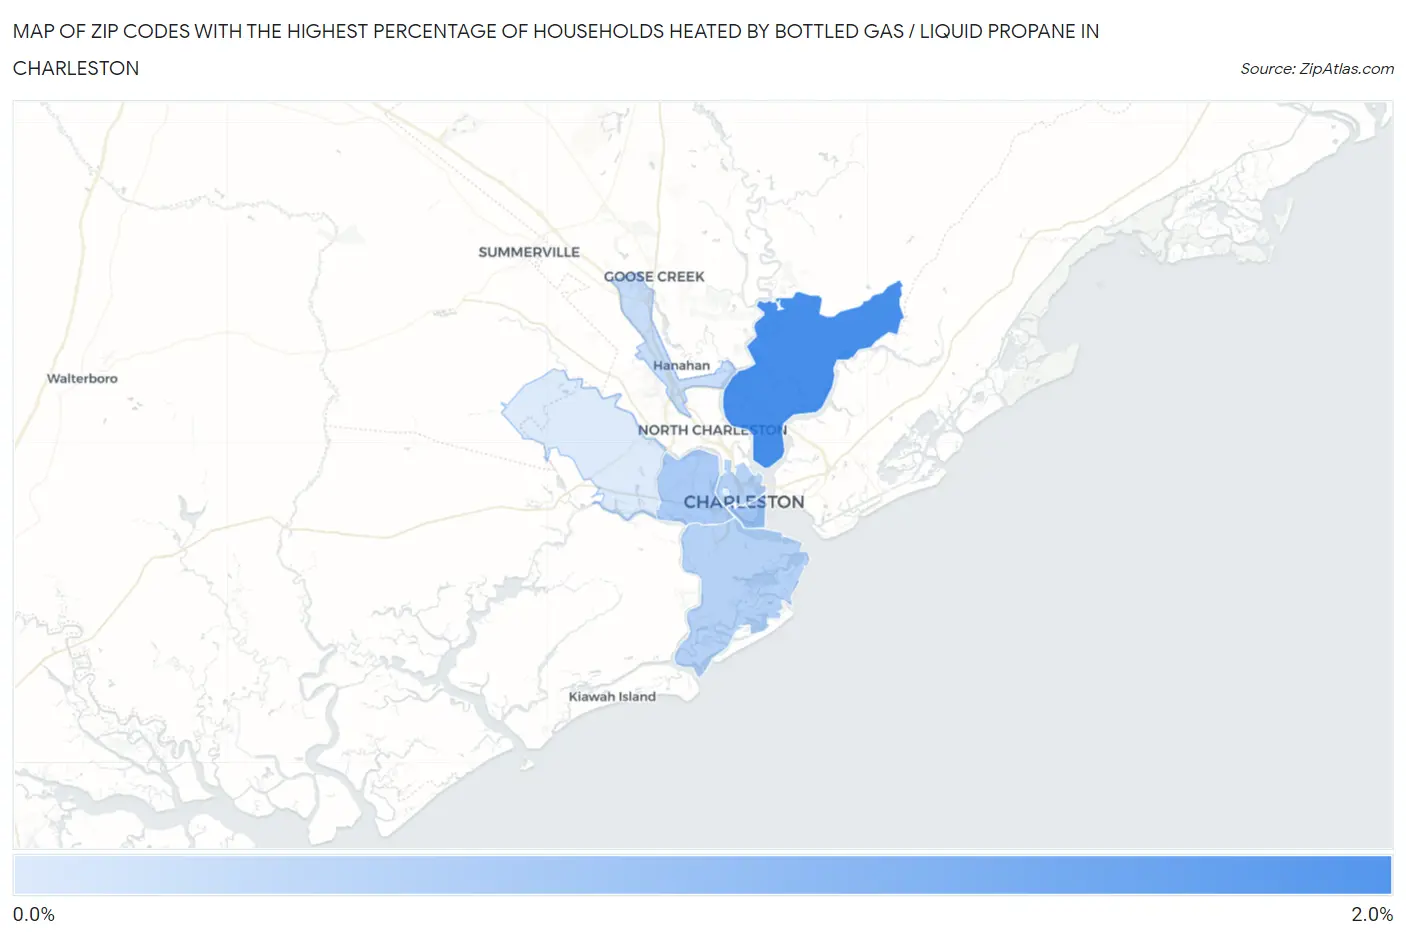
Map of Zip Codes with the Highest Percentage of Households Heated by Bottled Gas / Liquid Propane in Charleston
0.0%
2.0%
Zip Codes with the Highest Percentage of Households Heated by Bottled Gas / Liquid Propane in Charleston, SC
| Zip Code | Bottled Gas / LP Heating | vs State | vs National | |
| 1. | 29492 | 1.7% | 3.4%(-1.70)#307 | 4.9%(-3.20)#24,098 |
| 2. | 29401 | 0.80% | 3.4%(-2.60)#355 | 4.9%(-4.10)#27,661 |
| 3. | 29407 | 0.70% | 3.4%(-2.70)#359 | 4.9%(-4.20)#27,826 |
| 4. | 29412 | 0.60% | 3.4%(-2.80)#362 | 4.9%(-4.30)#28,169 |
| 5. | 29403 | 0.60% | 3.4%(-2.80)#365 | 4.9%(-4.30)#28,300 |
| 6. | 29406 | 0.40% | 3.4%(-3.00)#372 | 4.9%(-4.50)#28,878 |
| 7. | 29414 | 0.20% | 3.4%(-3.20)#378 | 4.9%(-4.70)#29,348 |
1
Common Questions
What are the Top 5 Zip Codes with the Highest Percentage of Households Heated by Bottled Gas / Liquid Propane in Charleston, SC?
Top 5 Zip Codes with the Highest Percentage of Households Heated by Bottled Gas / Liquid Propane in Charleston, SC are:
What zip code has the Highest Percentage of Households Heated by Bottled Gas / Liquid Propane in Charleston, SC?
29492 has the Highest Percentage of Households Heated by Bottled Gas / Liquid Propane in Charleston, SC with 1.7%.
What is the Percentage of Households Heated by Bottled Gas / Liquid Propane in Charleston, SC?
Percentage of Households Heated by Bottled Gas / Liquid Propane in Charleston is 0.50%.
What is the Percentage of Households Heated by Bottled Gas / Liquid Propane in South Carolina?
Percentage of Households Heated by Bottled Gas / Liquid Propane in South Carolina is 3.4%.
What is the Percentage of Households Heated by Bottled Gas / Liquid Propane in the United States?
Percentage of Households Heated by Bottled Gas / Liquid Propane in the United States is 4.9%.