Zip Codes with the Highest Percentage of Hispanic or Latino Population in Beaufort, SC
RELATED REPORTS & OPTIONS
Hispanic or Latino
Beaufort
Compare Zip Codes
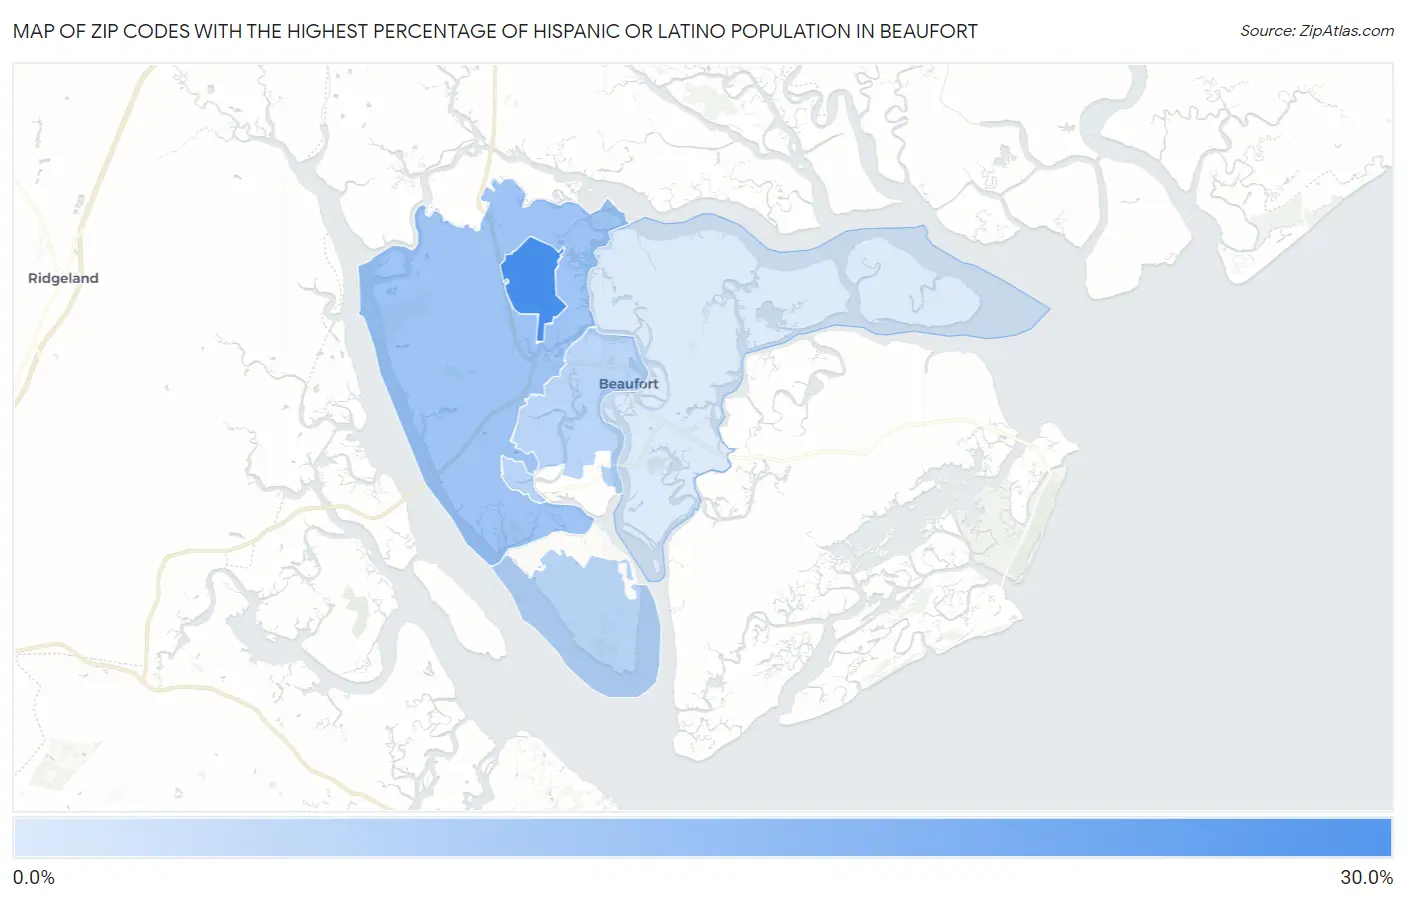
Map of Zip Codes with the Highest Percentage of Hispanic or Latino Population in Beaufort
4.0%
25.9%
Zip Codes with the Highest Percentage of Hispanic or Latino Population in Beaufort, SC
| Zip Code | Hispanic or Latino | vs State | vs National | |
| 1. | 29904 | 25.9% | 6.2%(+19.7)#7 | 18.7%(+7.21)#3,668 |
| 2. | 29906 | 12.7% | 6.2%(+6.53)#35 | 18.7%(-5.92)#7,382 |
| 3. | 29902 | 8.8% | 6.2%(+2.61)#69 | 18.7%(-9.85)#9,848 |
| 4. | 29907 | 4.0% | 6.2%(-2.19)#176 | 18.7%(-14.6)#16,126 |
1
Common Questions
What are the Top 3 Zip Codes with the Highest Percentage of Hispanic or Latino Population in Beaufort, SC?
Top 3 Zip Codes with the Highest Percentage of Hispanic or Latino Population in Beaufort, SC are:
What zip code has the Highest Percentage of Hispanic or Latino Population in Beaufort, SC?
29904 has the Highest Percentage of Hispanic or Latino Population in Beaufort, SC with 25.9%.
What is the Percentage of Hispanic or Latino Population in Beaufort, SC?
Percentage of Hispanic or Latino Population in Beaufort is 5.7%.
What is the Percentage of Hispanic or Latino Population in South Carolina?
Percentage of Hispanic or Latino Population in South Carolina is 6.2%.
What is the Percentage of Hispanic or Latino Population in the United States?
Percentage of Hispanic or Latino Population in the United States is 18.7%.