Zip Codes with the Highest Percentage of Population Employed in Construction & Extraction in Rhode Island

RELATED REPORTS & OPTIONS

Construction & Extraction
Population
Families and Households
Female Fertility
Female Fertility (Unmarried)
Race (Community Size)
Race (Percentage)
Ancestry (Community Size)
AfghanAfricanAlaska NativeAlaskan AthabascanAlbanianAleutAlsatianAmericanApacheArabArapahoArgentineanArmenianAssyrian / Chaldean / SyriacAustralianAustrianBahamianBangladeshiBarbadianBasqueBelgianBelizeanBermudanBhutaneseBlackfeetBolivianBrazilianBritishBritish West IndianBulgarianBurmeseCajunCambodianCanadianCape VerdeanCarpatho RusynCelticCentral AmericanCentral American IndianCherokeeCheyenneChickasawChileanChineseChippewaChoctawColombianColvilleComancheCosta RicanCreeCreekCroatianCrowCubanCypriotCzechCzechoslovakianDanishDelawareDominicanDutchDutch West IndianEastern EuropeanEcuadorianEgyptianEnglishEstonianEthiopianEuropeanFijianFilipinoFinnishFrenchFrench American IndianFrench CanadianGermanGerman RussianGhanaianGreekGuamanian / ChamorroGuatemalanGuyaneseHaitianHmongHonduranHopiHoumaHungarianIcelanderIndian (Asian)IndonesianInupiatIranianIraqiIrishIroquoisIsraeliItalianJamaicanJapaneseJordanianKenyanKiowaKoreanLaotianLatvianLebaneseLiberianLithuanianLumbeeLuxembourgerMacedonianMalaysianMalteseMarshalleseMenomineeMexicanMexican American IndianMongolianMoroccanNative HawaiianNavajoNepaleseNew ZealanderNicaraguanNigerianNorthern EuropeanNorwegianOkinawanOsageOttawaPaiutePakistaniPalestinianPanamanianParaguayanPennsylvania GermanPeruvianPimaPolishPortuguesePotawatomiPuebloPuerto RicanPuget Sound SalishRomanianRussianSalvadoranSamoanScandinavianScotch-IrishScottishSeminoleSenegaleseSerbianShoshoneSierra LeoneanSiouxSlavicSlovakSloveneSomaliSouth AfricanSouth AmericanSouth American IndianSoviet UnionSpaniardSpanishSpanish AmericanSpanish American IndianSri LankanSubsaharan AfricanSudaneseSwedishSwissSyrianTaiwaneseThaiTlingit-HaidaTohono O'OdhamTonganTrinidadian and TobagonianTsimshianTurkishU.S. Virgin IslanderUgandanUkrainianUruguayanUteVenezuelanVietnameseWelshWest IndianYakamaYaquiYugoslavianYumanYup'ikZimbabwean
Ancestry (Percentage)
AfghanAfricanAlaska NativeAlaskan AthabascanAlbanianAleutAlsatianAmericanApacheArabArapahoArgentineanArmenianAssyrian / Chaldean / SyriacAustralianAustrianBahamianBangladeshiBarbadianBasqueBelgianBelizeanBermudanBhutaneseBlackfeetBolivianBrazilianBritishBritish West IndianBulgarianBurmeseCajunCambodianCanadianCape VerdeanCarpatho RusynCelticCentral AmericanCentral American IndianCherokeeCheyenneChickasawChileanChineseChippewaChoctawColombianColvilleComancheCosta RicanCreeCreekCroatianCrowCubanCypriotCzechCzechoslovakianDanishDelawareDominicanDutchDutch West IndianEastern EuropeanEcuadorianEgyptianEnglishEstonianEthiopianEuropeanFijianFilipinoFinnishFrenchFrench American IndianFrench CanadianGermanGerman RussianGhanaianGreekGuamanian / ChamorroGuatemalanGuyaneseHaitianHmongHonduranHopiHoumaHungarianIcelanderIndian (Asian)IndonesianInupiatIranianIraqiIrishIroquoisIsraeliItalianJamaicanJapaneseJordanianKenyanKiowaKoreanLaotianLatvianLebaneseLiberianLithuanianLumbeeLuxembourgerMacedonianMalaysianMalteseMarshalleseMenomineeMexicanMexican American IndianMongolianMoroccanNative HawaiianNavajoNepaleseNew ZealanderNicaraguanNigerianNorthern EuropeanNorwegianOkinawanOsageOttawaPaiutePakistaniPalestinianPanamanianParaguayanPennsylvania GermanPeruvianPimaPolishPortuguesePotawatomiPuebloPuerto RicanPuget Sound SalishRomanianRussianSalvadoranSamoanScandinavianScotch-IrishScottishSeminoleSenegaleseSerbianShoshoneSierra LeoneanSiouxSlavicSlovakSloveneSomaliSouth AfricanSouth AmericanSouth American IndianSoviet UnionSpaniardSpanishSpanish AmericanSpanish American IndianSri LankanSubsaharan AfricanSudaneseSwedishSwissSyrianTaiwaneseThaiTlingit-HaidaTohono O'OdhamTonganTrinidadian and TobagonianTsimshianTurkishU.S. Virgin IslanderUgandanUkrainianUruguayanUteVenezuelanVietnameseWelshWest IndianYakamaYaquiYugoslavianYumanYup'ikZimbabwean
Immigrant Origin (Total)
AfghanistanAfricaAlbaniaArgentinaArmeniaAsiaAustraliaAustriaAzoresBahamasBangladeshBarbadosBelarusBelgiumBelizeBoliviaBosnia and HerzegovinaBrazilBulgariaBurma / MyanmarCabo VerdeCambodiaCameroonCanadaCaribbeanCentral AmericaChileChinaColombiaCongoCosta RicaCroatiaCubaCzechoslovakiaDenmarkDominicaDominican RepublicEastern AfricaEastern AsiaEastern EuropeEcuadorEgyptEl SalvadorEnglandEritreaEthiopiaEuropeFijiFranceGermanyGhanaGreeceGrenadaGuatemalaGuyanaHaitiHondurasHong KongHungaryIndiaIndonesiaIranIraqIrelandIsraelItalyJamaicaJapanJordanKazakhstanKenyaKoreaKuwaitLaosLatin AmericaLatviaLebanonLiberiaLithuaniaMalaysiaMexicoMicronesiaMiddle AfricaMoldovaMoroccoNepalNetherlandsNicaraguaNigeriaNorth MacedoniaNorthern AfricaNorthern EuropeNorwayOceaniaPakistanPanamaPeruPhilippinesPolandPortugalRomaniaRussiaSaudi ArabiaScotlandSenegalSerbiaSierra LeoneSingaporeSomaliaSouth AfricaSouth AmericaSouth Central AsiaSouth Eastern AsiaSouthern EuropeSpainSri LankaSt. Vincent and the GrenadinesSudanSwedenSwitzerlandSyriaTaiwanThailandTrinidad and TobagoTurkeyUgandaUkraineUruguayUzbekistanVenezuelaVietnamWest IndiesWestern AfricaWestern AsiaWestern EuropeYemenZaireZimbabwe
Immigrant Origin (Percentage)
AfghanistanAfricaAlbaniaArgentinaArmeniaAsiaAustraliaAustriaAzoresBahamasBangladeshBarbadosBelarusBelgiumBelizeBoliviaBosnia and HerzegovinaBrazilBulgariaBurma / MyanmarCabo VerdeCambodiaCameroonCanadaCaribbeanCentral AmericaChileChinaColombiaCongoCosta RicaCroatiaCubaCzechoslovakiaDenmarkDominicaDominican RepublicEastern AfricaEastern AsiaEastern EuropeEcuadorEgyptEl SalvadorEnglandEritreaEthiopiaEuropeFijiFranceGermanyGhanaGreeceGrenadaGuatemalaGuyanaHaitiHondurasHong KongHungaryIndiaIndonesiaIranIraqIrelandIsraelItalyJamaicaJapanJordanKazakhstanKenyaKoreaKuwaitLaosLatin AmericaLatviaLebanonLiberiaLithuaniaMalaysiaMexicoMicronesiaMiddle AfricaMoldovaMoroccoNepalNetherlandsNicaraguaNigeriaNorth MacedoniaNorthern AfricaNorthern EuropeNorwayOceaniaPakistanPanamaPeruPhilippinesPolandPortugalRomaniaRussiaSaudi ArabiaScotlandSenegalSerbiaSierra LeoneSingaporeSomaliaSouth AfricaSouth AmericaSouth Central AsiaSouth Eastern AsiaSouthern EuropeSpainSri LankaSt. Vincent and the GrenadinesSudanSwedenSwitzerlandSyriaTaiwanThailandTrinidad and TobagoTurkeyUgandaUkraineUruguayUzbekistanVenezuelaVietnamWest IndiesWestern AfricaWestern AsiaWestern EuropeYemenZaireZimbabwe
Income
Income (Families)
Income (Households)
Poverty
Poverty (Families)
Unemployment
Employment Occupations
Employment Industries
Employer Class
Commute Time
Commute Means
School Enrollment
Education by Degree Field
Occupancy
Finances
Physical Characteristics
Rhode Island
Compare Zip Codes
Comparison Subject

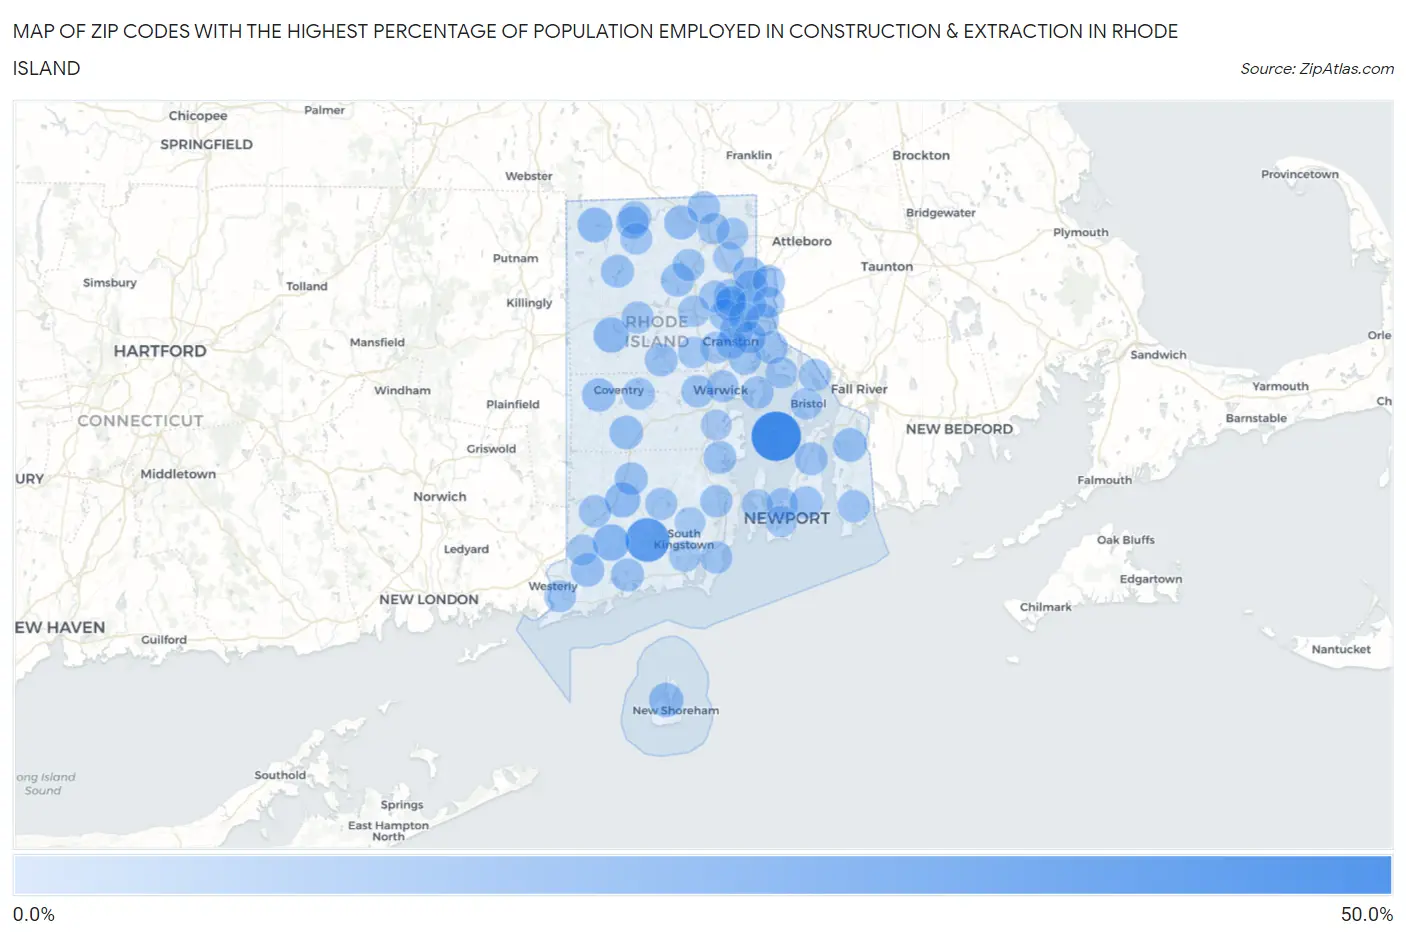
Map of Zip Codes with the Highest Percentage of Population Employed in Construction & Extraction in Rhode Island

0.0%
50.0%
Zip Codes with the Highest Percentage of Population Employed in Construction & Extraction in Rhode Island Map

Zip Codes with the Highest Percentage of Population Employed in Construction & Extraction in Rhode Island

Zip Code % Employed vs State vs National
1.0287244.4%4.4%(+40.0)#15.0%(+39.5)#165
2.0283631.2%4.4%(+26.8)#25.0%(+26.3)#366
3.0289414.2%4.4%(+9.78)#35.0%(+9.23)#2,357
4.0282511.6%4.4%(+7.12)#45.0%(+6.57)#3,913
5.0289810.8%4.4%(+6.40)#55.0%(+5.85)#4,527
6.0285910.2%4.4%(+5.79)#65.0%(+5.24)#5,150
7.028079.2%4.4%(+4.79)#75.0%(+4.24)#6,397
8.028968.4%4.4%(+4.00)#85.0%(+3.45)#7,681
9.028788.2%4.4%(+3.76)#95.0%(+3.21)#8,101
10.028178.0%4.4%(+3.56)#105.0%(+3.01)#8,475
11.028637.6%4.4%(+3.16)#115.0%(+2.61)#9,315
12.028277.5%4.4%(+3.01)#125.0%(+2.46)#9,623
13.028087.4%4.4%(+2.91)#135.0%(+2.36)#9,855
14.028287.1%4.4%(+2.69)#145.0%(+2.14)#10,399
15.028146.6%4.4%(+2.20)#155.0%(+1.65)#11,631
16.028136.4%4.4%(+1.96)#165.0%(+1.41)#12,303
17.028226.3%4.4%(+1.90)#175.0%(+1.35)#12,480
18.028716.3%4.4%(+1.89)#185.0%(+1.34)#12,511
19.029156.2%4.4%(+1.72)#195.0%(+1.17)#13,003
20.028316.1%4.4%(+1.70)#205.0%(+1.15)#13,070
21.028526.1%4.4%(+1.62)#215.0%(+1.07)#13,302
22.029145.7%4.4%(+1.27)#225.0%(+0.721)#14,331
23.029075.7%4.4%(+1.26)#235.0%(+0.711)#14,374
24.028955.6%4.4%(+1.16)#245.0%(+0.613)#14,688
25.028265.5%4.4%(+1.07)#255.0%(+0.521)#14,975
26.028425.4%4.4%(+0.958)#265.0%(+0.408)#15,376
27.028305.4%4.4%(+0.951)#275.0%(+0.401)#15,396
28.028605.2%4.4%(+0.755)#285.0%(+0.205)#16,048
29.028325.1%4.4%(+0.655)#295.0%(+0.106)#16,367
30.028935.1%4.4%(+0.654)#305.0%(+0.105)#16,372
31.028895.1%4.4%(+0.645)#315.0%(+0.095)#16,412
32.028375.1%4.4%(+0.606)#325.0%(+0.056)#16,555
33.028885.0%4.4%(+0.581)#335.0%(+0.032)#16,660
34.028744.8%4.4%(+0.371)#345.0%(-0.178)#17,374
35.028824.8%4.4%(+0.318)#355.0%(-0.231)#17,561
36.028574.7%4.4%(+0.294)#365.0%(-0.255)#17,656
37.028614.6%4.4%(+0.122)#375.0%(-0.428)#18,270
38.029174.5%4.4%(+0.091)#385.0%(-0.458)#18,374
39.028854.4%4.4%(-0.093)#395.0%(-0.643)#19,034
40.028924.3%4.4%(-0.097)#405.0%(-0.646)#19,043
41.028864.3%4.4%(-0.129)#415.0%(-0.679)#19,159
42.029054.3%4.4%(-0.192)#425.0%(-0.741)#19,404
43.028914.0%4.4%(-0.420)#435.0%(-0.969)#20,240
44.029084.0%4.4%(-0.432)#445.0%(-0.981)#20,275
45.028164.0%4.4%(-0.448)#455.0%(-0.998)#20,348
46.028643.9%4.4%(-0.549)#465.0%(-1.10)#20,702
47.028393.8%4.4%(-0.645)#475.0%(-1.19)#21,028
48.028063.7%4.4%(-0.741)#485.0%(-1.29)#21,337
49.029203.6%4.4%(-0.869)#495.0%(-1.42)#21,754
50.029043.5%4.4%(-0.952)#505.0%(-1.50)#22,038
51.028383.4%4.4%(-1.04)#515.0%(-1.59)#22,312
52.029113.3%4.4%(-1.14)#525.0%(-1.69)#22,613
53.028093.3%4.4%(-1.15)#535.0%(-1.70)#22,668
54.029193.3%4.4%(-1.18)#545.0%(-1.73)#22,765
55.028793.2%4.4%(-1.27)#555.0%(-1.82)#23,043
56.029093.1%4.4%(-1.31)#565.0%(-1.86)#23,149
57.028413.1%4.4%(-1.34)#575.0%(-1.89)#23,259
58.029163.1%4.4%(-1.37)#585.0%(-1.92)#23,371
59.029213.0%4.4%(-1.41)#595.0%(-1.96)#23,498
60.029102.6%4.4%(-1.88)#605.0%(-2.43)#24,885
61.028352.5%4.4%(-1.98)#615.0%(-2.53)#25,141
62.028042.2%4.4%(-2.24)#625.0%(-2.79)#25,814
63.028402.2%4.4%(-2.25)#635.0%(-2.80)#25,849
64.028651.8%4.4%(-2.63)#645.0%(-3.18)#26,750
65.028181.6%4.4%(-2.80)#655.0%(-3.35)#27,104
66.028811.1%4.4%(-3.30)#665.0%(-3.85)#28,073
67.029061.1%4.4%(-3.35)#675.0%(-3.90)#28,144
68.029030.95%4.4%(-3.49)#685.0%(-4.04)#28,398
69.029180.88%4.4%(-3.57)#695.0%(-4.12)#28,500

Common Questions

What are the Top 10 Zip Codes with the Highest Percentage of Population Employed in Construction & Extraction in Rhode Island?
Top 10 Zip Codes with the Highest Percentage of Population Employed in Construction & Extraction in Rhode Island are:
#1
44.4%
#2
31.2%
#3
14.2%
#4
11.6%
#5
10.8%
#6
10.2%
#7
9.2%
#8
8.4%
#9
8.2%
#10
8.0%
What zip code has the Highest Percentage of Population Employed in Construction & Extraction in Rhode Island?
02872 has the Highest Percentage of Population Employed in Construction & Extraction in Rhode Island with 44.4%.
What is the Percentage of Population Employed in Construction & Extraction in the State of Rhode Island?
Percentage of Population Employed in Construction & Extraction in Rhode Island is 4.4%.
What is the Percentage of Population Employed in Construction & Extraction in the United States?
Percentage of Population Employed in Construction & Extraction in the United States is 5.0%.