Zip Codes with the Highest Percentage of Population Driving Alone to Work in Warwick, RI
RELATED REPORTS & OPTIONS
Drive | Alone
Warwick
Compare Zip Codes
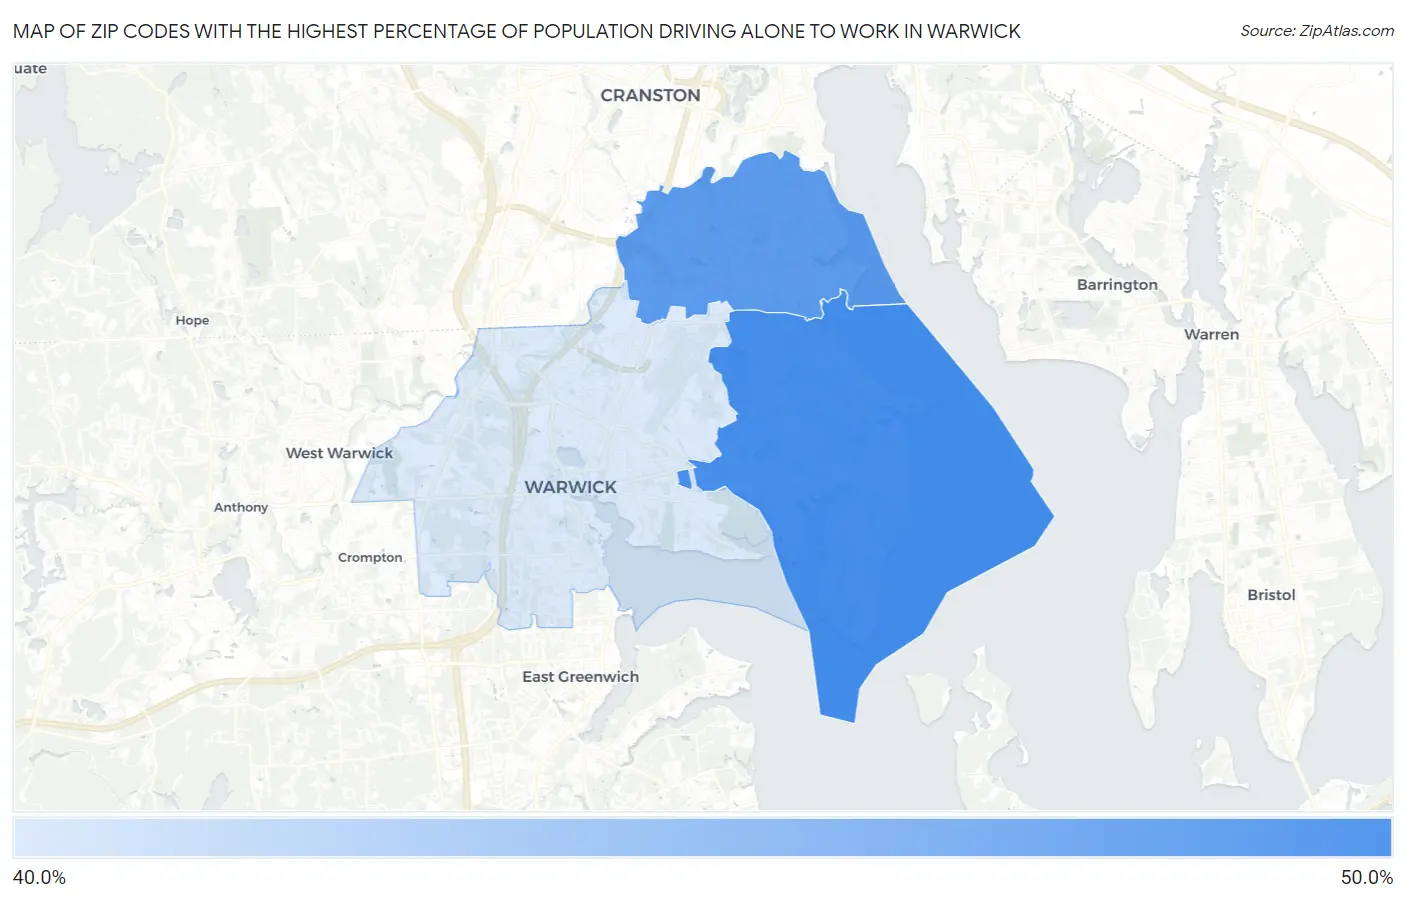
Map of Zip Codes with the Highest Percentage of Population Driving Alone to Work in Warwick
41.3%
46.4%
Zip Codes with the Highest Percentage of Population Driving Alone to Work in Warwick, RI
| Zip Code | % Drive Alone | vs State | vs National | |
| 1. | 02889 | 46.4% | 43.3%(+3.10)#30 | 42.1%(+4.30)#9,806 |
| 2. | 02888 | 45.8% | 43.3%(+2.50)#34 | 42.1%(+3.70)#11,072 |
| 3. | 02886 | 41.3% | 43.3%(-2.00)#53 | 42.1%(-0.800)#22,234 |
1
Common Questions
What are the Top Zip Codes with the Highest Percentage of Population Driving Alone to Work in Warwick, RI?
Top Zip Codes with the Highest Percentage of Population Driving Alone to Work in Warwick, RI are:
What zip code has the Highest Percentage of Population Driving Alone to Work in Warwick, RI?
02889 has the Highest Percentage of Population Driving Alone to Work in Warwick, RI with 46.4%.
What is the Percentage of Population Driving Alone to Work in Warwick, RI?
Percentage of Population Driving Alone to Work in Warwick is 44.1%.
What is the Percentage of Population Driving Alone to Work in Rhode Island?
Percentage of Population Driving Alone to Work in Rhode Island is 43.3%.
What is the Percentage of Population Driving Alone to Work in the United States?
Percentage of Population Driving Alone to Work in the United States is 42.1%.