Zip Codes with the Highest Percentage of Population Employed in Agriculture, Fishing & Hunting in San Juan, PR
RELATED REPORTS & OPTIONS
Agriculture, Fishing & Hunting
San Juan
Compare Zip Codes
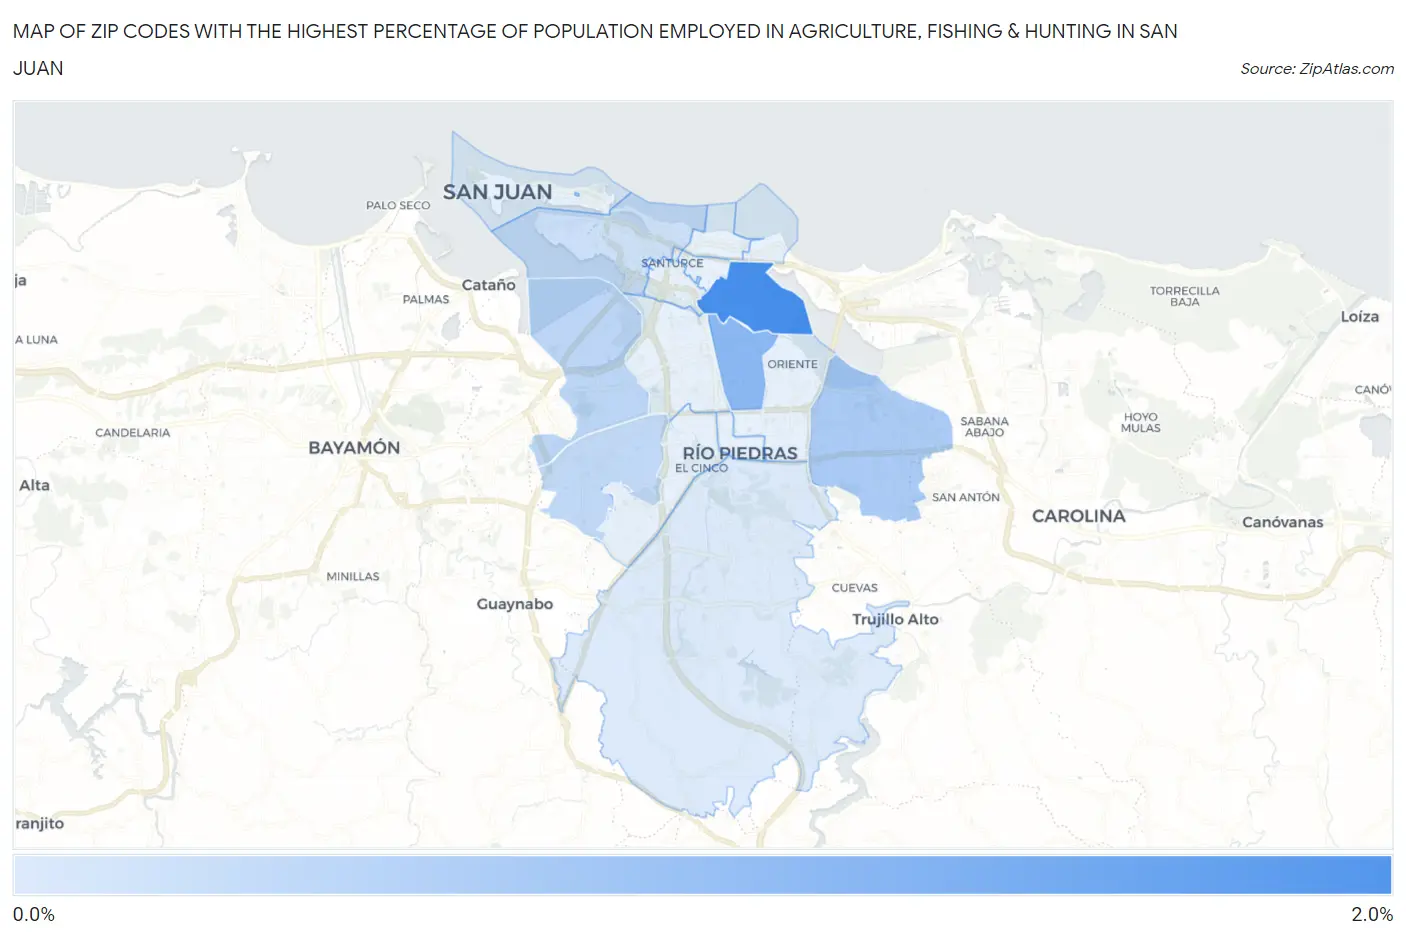
Map of Zip Codes with the Highest Percentage of Population Employed in Agriculture, Fishing & Hunting in San Juan
0.0%
2.0%
Zip Codes with the Highest Percentage of Population Employed in Agriculture, Fishing & Hunting in San Juan, PR
| Zip Code | % Employed | vs State | vs National | |
| 1. | 00915 | 1.7% | 1.3%(+0.406)#45 | 1.2%(+0.514)#13,605 |
| 2. | 00917 | 1.0% | 1.3%(-0.306)#62 | 1.2%(-0.198)#16,211 |
| 3. | 00924 | 0.64% | 1.3%(-0.664)#76 | 1.2%(-0.555)#18,174 |
| 4. | 00920 | 0.45% | 1.3%(-0.858)#83 | 1.2%(-0.750)#19,706 |
| 5. | 00921 | 0.41% | 1.3%(-0.897)#84 | 1.2%(-0.788)#20,048 |
| 6. | 00907 | 0.27% | 1.3%(-1.03)#91 | 1.2%(-0.925)#21,484 |
| 7. | 00926 | 0.11% | 1.3%(-1.19)#101 | 1.2%(-1.08)#23,478 |
1
Common Questions
What are the Top 10 Zip Codes with the Highest Percentage of Population Employed in Agriculture, Fishing & Hunting in San Juan, PR?
Top 10 Zip Codes with the Highest Percentage of Population Employed in Agriculture, Fishing & Hunting in San Juan, PR are:
What zip code has the Highest Percentage of Population Employed in Agriculture, Fishing & Hunting in San Juan, PR?
00915 has the Highest Percentage of Population Employed in Agriculture, Fishing & Hunting in San Juan, PR with 1.7%.
What is the Percentage of Population Employed in Agriculture, Fishing & Hunting in San Juan, PR?
Percentage of Population Employed in Agriculture, Fishing & Hunting in San Juan is 0.31%.
What is the Percentage of Population Employed in Agriculture, Fishing & Hunting in Puerto Rico?
Percentage of Population Employed in Agriculture, Fishing & Hunting in Puerto Rico is 1.3%.
What is the Percentage of Population Employed in Agriculture, Fishing & Hunting in the United States?
Percentage of Population Employed in Agriculture, Fishing & Hunting in the United States is 1.2%.