Zip Codes with the Highest Percentage of Households Heated by Bottled Gas / Liquid Propane in San Juan, PR
RELATED REPORTS & OPTIONS
Bottled Gas / LP Heating
San Juan
Compare Zip Codes
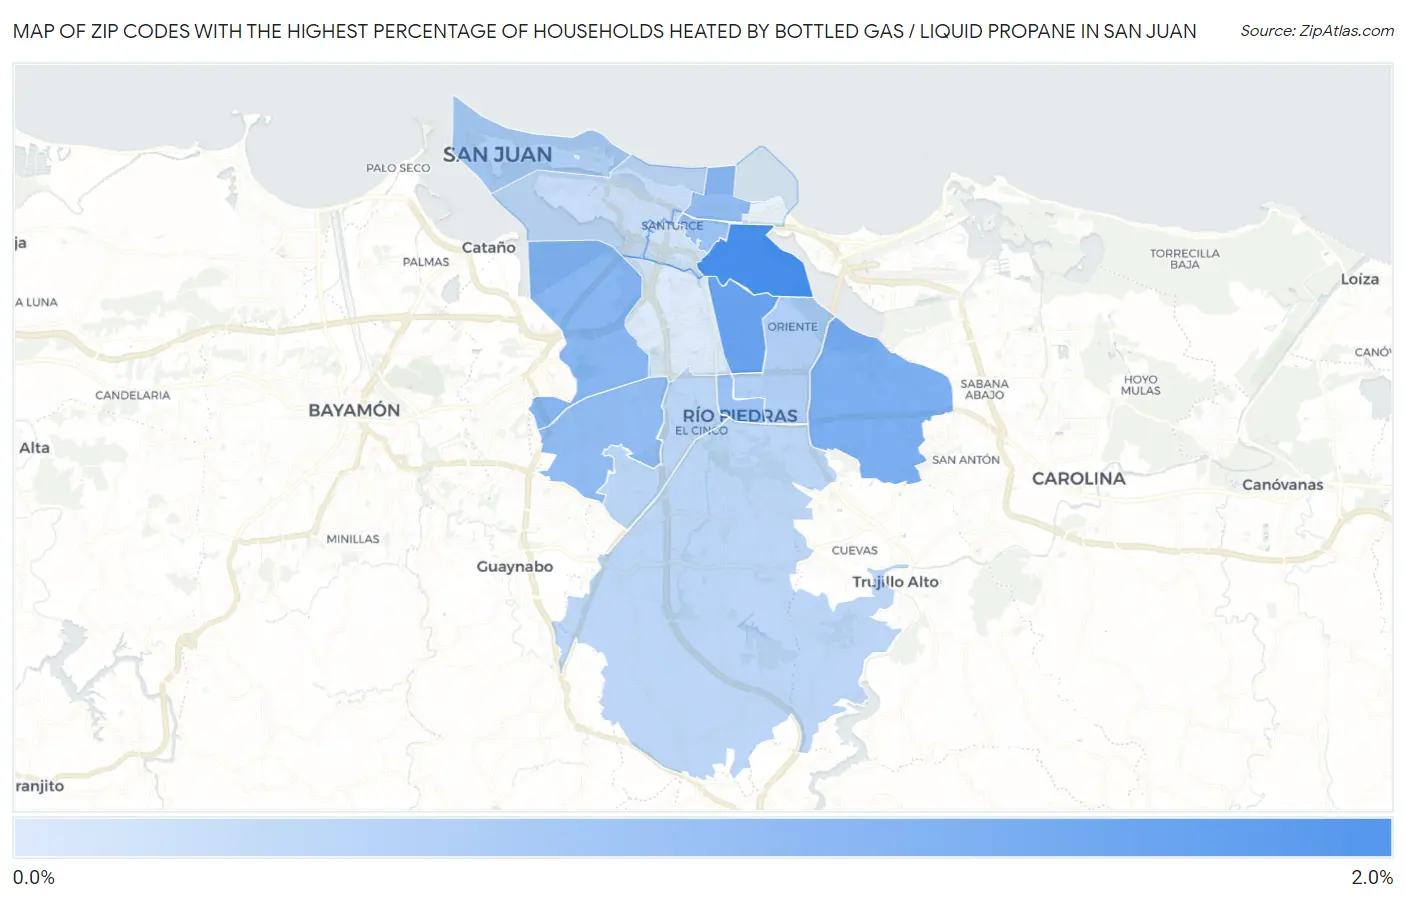
Map of Zip Codes with the Highest Percentage of Households Heated by Bottled Gas / Liquid Propane in San Juan
0.0%
2.0%
Zip Codes with the Highest Percentage of Households Heated by Bottled Gas / Liquid Propane in San Juan, PR
| Zip Code | Bottled Gas / LP Heating | vs State | vs National | |
| 1. | 00915 | 1.7% | 0.80%(+0.900)#5 | 4.9%(-3.20)#24,070 |
| 2. | 00917 | 1.4% | 0.80%(+0.600)#11 | 4.9%(-3.50)#25,182 |
| 3. | 00924 | 1.2% | 0.80%(+0.400)#15 | 4.9%(-3.70)#25,772 |
| 4. | 00920 | 1.1% | 0.80%(+0.300)#24 | 4.9%(-3.80)#26,344 |
| 5. | 00921 | 1.0% | 0.80%(+0.200)#30 | 4.9%(-3.90)#26,629 |
| 6. | 00911 | 1.0% | 0.80%(+0.200)#33 | 4.9%(-3.90)#26,855 |
| 7. | 00912 | 0.90% | 0.80%(+0.100)#45 | 4.9%(-4.00)#27,289 |
| 8. | 00925 | 0.90% | 0.80%(+0.100)#46 | 4.9%(-4.00)#27,290 |
| 9. | 00923 | 0.70% | 0.80%(-0.100)#62 | 4.9%(-4.20)#27,902 |
| 10. | 00901 | 0.70% | 0.80%(-0.100)#68 | 4.9%(-4.20)#28,040 |
| 11. | 00926 | 0.60% | 0.80%(-0.200)#71 | 4.9%(-4.30)#28,095 |
| 12. | 00927 | 0.60% | 0.80%(-0.200)#84 | 4.9%(-4.30)#28,359 |
| 13. | 00907 | 0.50% | 0.80%(-0.300)#93 | 4.9%(-4.40)#28,680 |
| 14. | 00909 | 0.40% | 0.80%(-0.400)#108 | 4.9%(-4.50)#29,047 |
| 15. | 00918 | 0.30% | 0.80%(-0.500)#111 | 4.9%(-4.60)#29,231 |
1
Common Questions
What are the Top 10 Zip Codes with the Highest Percentage of Households Heated by Bottled Gas / Liquid Propane in San Juan, PR?
Top 10 Zip Codes with the Highest Percentage of Households Heated by Bottled Gas / Liquid Propane in San Juan, PR are:
What zip code has the Highest Percentage of Households Heated by Bottled Gas / Liquid Propane in San Juan, PR?
00915 has the Highest Percentage of Households Heated by Bottled Gas / Liquid Propane in San Juan, PR with 1.7%.
What is the Percentage of Households Heated by Bottled Gas / Liquid Propane in San Juan, PR?
Percentage of Households Heated by Bottled Gas / Liquid Propane in San Juan is 0.80%.
What is the Percentage of Households Heated by Bottled Gas / Liquid Propane in Puerto Rico?
Percentage of Households Heated by Bottled Gas / Liquid Propane in Puerto Rico is 0.80%.
What is the Percentage of Households Heated by Bottled Gas / Liquid Propane in the United States?
Percentage of Households Heated by Bottled Gas / Liquid Propane in the United States is 4.9%.