Zip Codes with the Highest Percentage of Population Taking Public Transit to Work in Bayamon, PR
RELATED REPORTS & OPTIONS
Public Transit
Bayamon
Compare Zip Codes
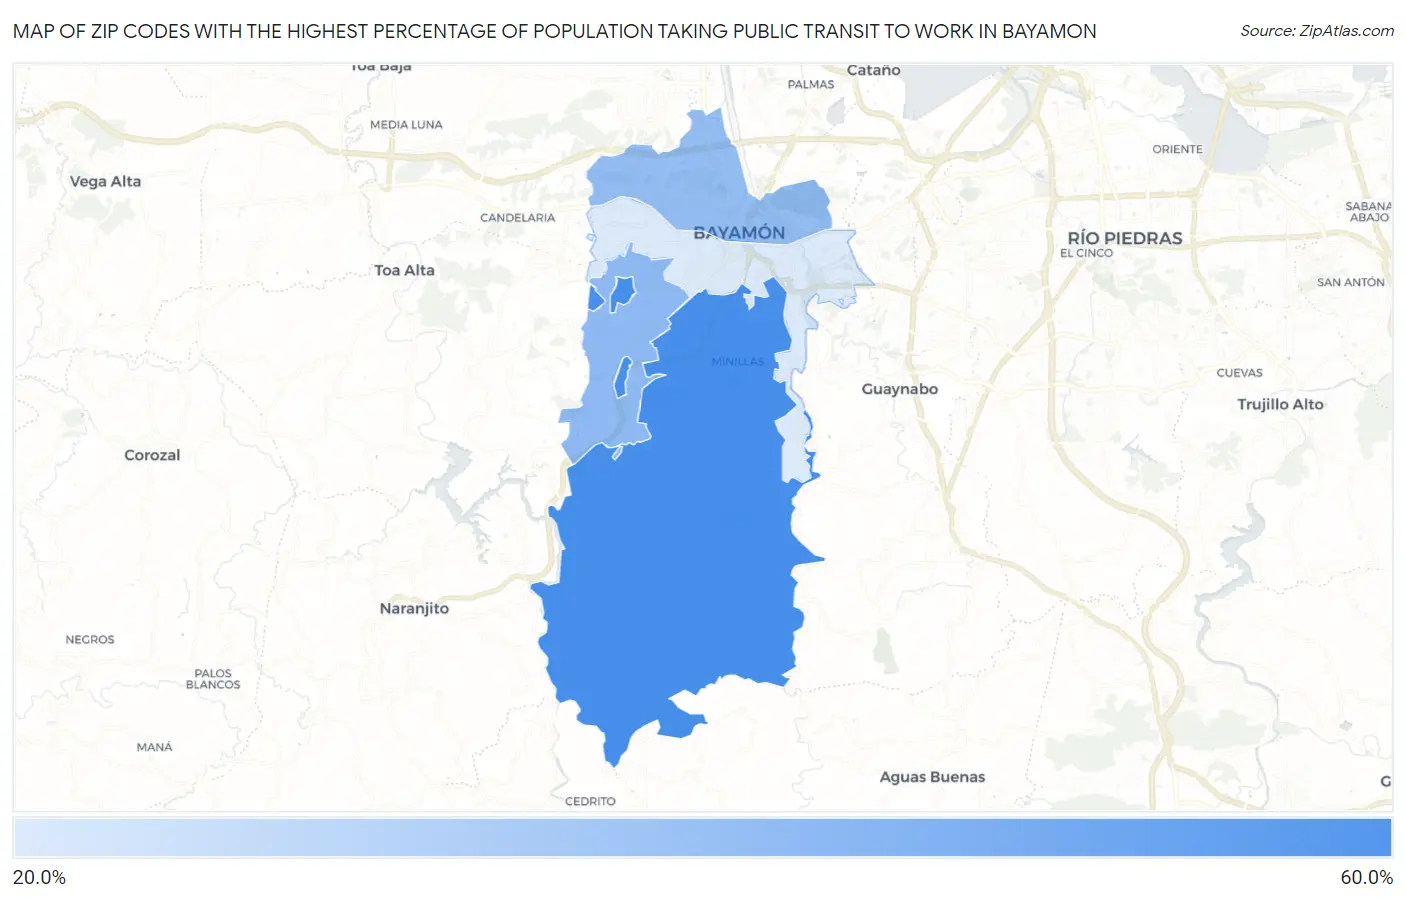
Map of Zip Codes with the Highest Percentage of Population Taking Public Transit to Work in Bayamon
22.8%
57.1%
Zip Codes with the Highest Percentage of Population Taking Public Transit to Work in Bayamon, PR
| Zip Code | % Public Transit | vs State | vs National | |
| 1. | 00956 | 57.1% | 45.0%(+12.1)#6 | 38.5%(+18.6)#555 |
| 2. | 00957 | 39.7% | 45.0%(-5.30)#36 | 38.5%(+1.20)#4,289 |
| 3. | 00961 | 38.6% | 45.0%(-6.40)#38 | 38.5%(+0.100)#4,648 |
| 4. | 00959 | 22.8% | 45.0%(-22.2)#50 | 38.5%(-15.7)#7,816 |
1
Common Questions
What are the Top 3 Zip Codes with the Highest Percentage of Population Taking Public Transit to Work in Bayamon, PR?
Top 3 Zip Codes with the Highest Percentage of Population Taking Public Transit to Work in Bayamon, PR are:
What zip code has the Highest Percentage of Population Taking Public Transit to Work in Bayamon, PR?
00956 has the Highest Percentage of Population Taking Public Transit to Work in Bayamon, PR with 57.1%.
What is the Percentage of Population Taking Public Transit to Work in Puerto Rico?
Percentage of Population Taking Public Transit to Work in Puerto Rico is 45.0%.
What is the Percentage of Population Taking Public Transit to Work in the United States?
Percentage of Population Taking Public Transit to Work in the United States is 38.5%.