Zip Codes with the Highest Percentage of Hispanic or Latino Population in Bayamon, PR
RELATED REPORTS & OPTIONS
Hispanic or Latino
Bayamon
Compare Zip Codes
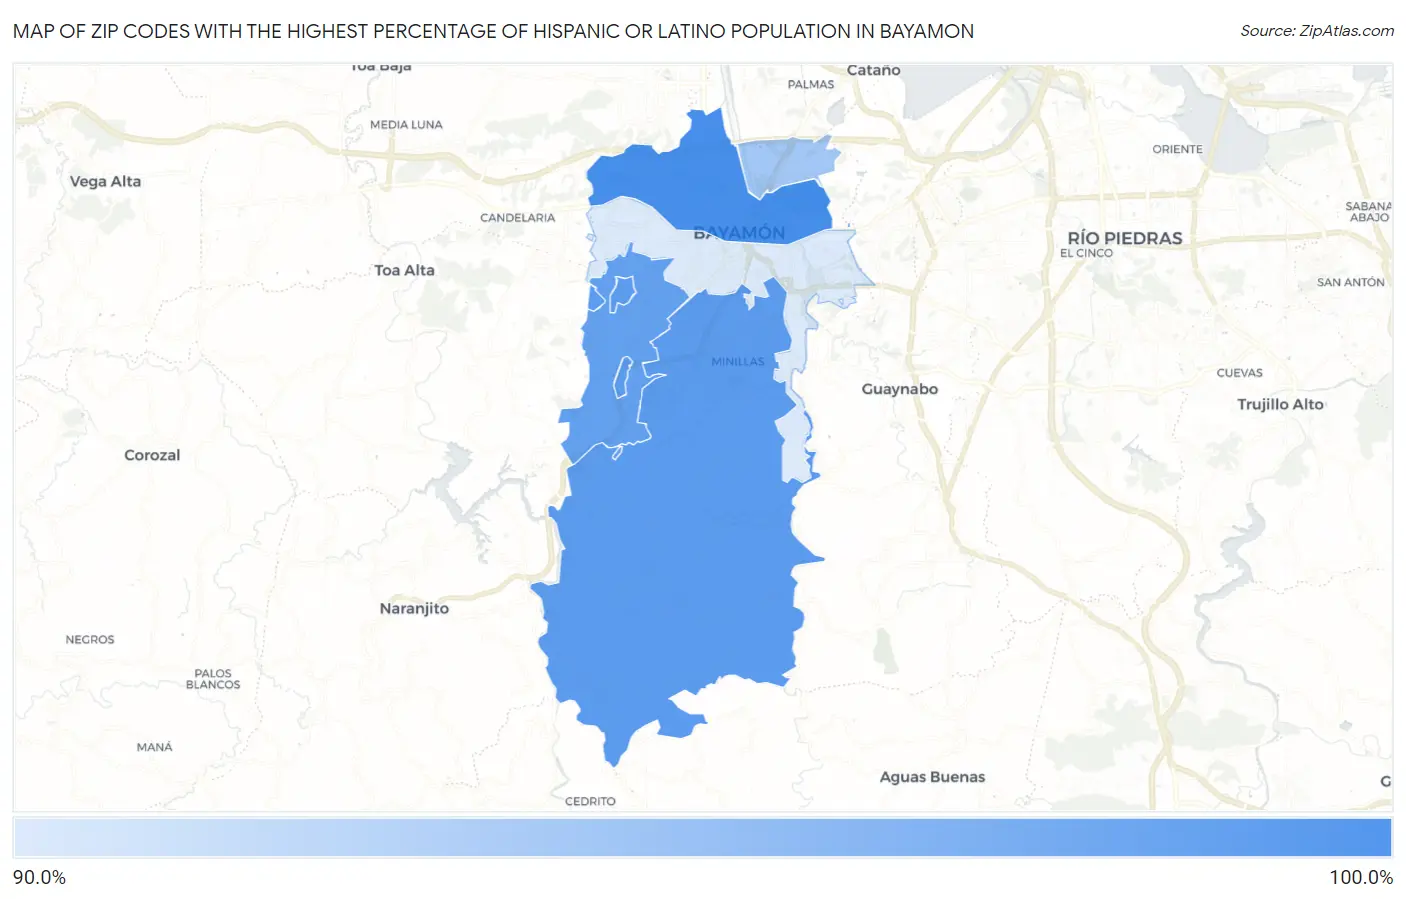
Map of Zip Codes with the Highest Percentage of Hispanic or Latino Population in Bayamon
97.6%
99.4%
Zip Codes with the Highest Percentage of Hispanic or Latino Population in Bayamon, PR
| Zip Code | Hispanic or Latino | vs State | vs National | |
| 1. | 00961 | 99.4% | 98.7%(+0.633)#47 | 18.7%(+80.7)#112 |
| 2. | 00956 | 99.1% | 98.7%(+0.393)#65 | 18.7%(+80.5)#133 |
| 3. | 00957 | 99.0% | 98.7%(+0.304)#74 | 18.7%(+80.4)#143 |
| 4. | 00960 | 98.3% | 98.7%(-0.449)#98 | 18.7%(+79.6)#176 |
| 5. | 00959 | 97.6% | 98.7%(-1.12)#111 | 18.7%(+79.0)#197 |
1
Common Questions
What are the Top 3 Zip Codes with the Highest Percentage of Hispanic or Latino Population in Bayamon, PR?
Top 3 Zip Codes with the Highest Percentage of Hispanic or Latino Population in Bayamon, PR are:
What zip code has the Highest Percentage of Hispanic or Latino Population in Bayamon, PR?
00961 has the Highest Percentage of Hispanic or Latino Population in Bayamon, PR with 99.4%.
What is the Percentage of Hispanic or Latino Population in Bayamon, PR?
Percentage of Hispanic or Latino Population in Bayamon is 100.0%.
What is the Percentage of Hispanic or Latino Population in Puerto Rico?
Percentage of Hispanic or Latino Population in Puerto Rico is 98.7%.
What is the Percentage of Hispanic or Latino Population in the United States?
Percentage of Hispanic or Latino Population in the United States is 18.7%.