Thai vs West Indian Receiving Food Stamps
COMPARE
Thai
West Indian
Receiving Food Stamps
Receiving Food Stamps Comparison
Thais
West Indians
8.1%
RECEIVING FOOD STAMPS
100.0/ 100
METRIC RATING
5th/ 347
METRIC RANK
16.3%
RECEIVING FOOD STAMPS
0.0/ 100
METRIC RATING
304th/ 347
METRIC RANK
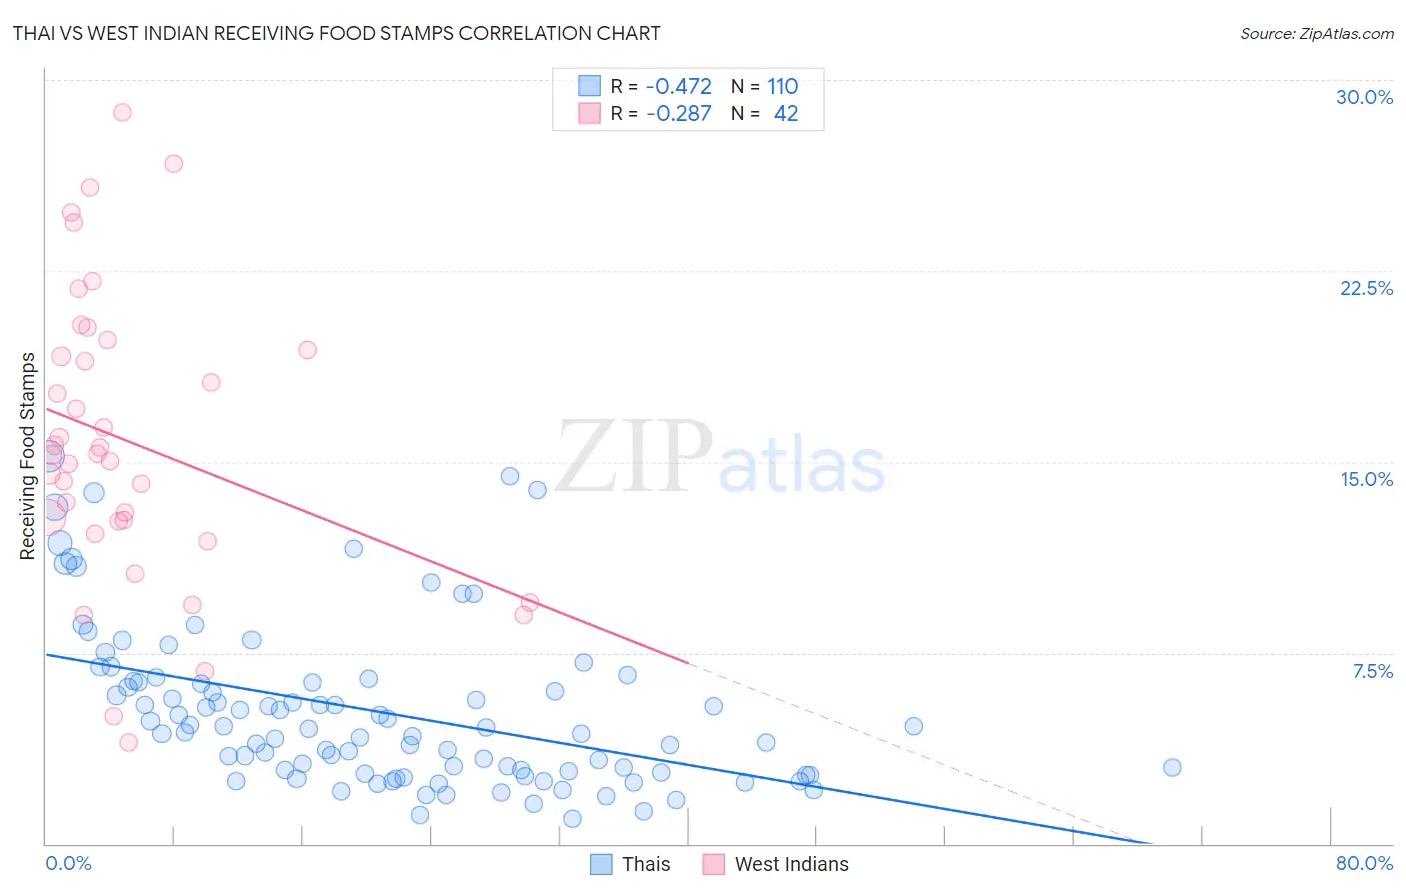
Thai vs West Indian Receiving Food Stamps Correlation Chart
The statistical analysis conducted on geographies consisting of 473,754,114 people shows a moderate negative correlation between the proportion of Thais and percentage of population receiving government assistance and/or food stamps in the United States with a correlation coefficient (R) of -0.472 and weighted average of 8.1%. Similarly, the statistical analysis conducted on geographies consisting of 253,628,071 people shows a weak negative correlation between the proportion of West Indians and percentage of population receiving government assistance and/or food stamps in the United States with a correlation coefficient (R) of -0.287 and weighted average of 16.3%, a difference of 100.3%.
Receiving Food Stamps Correlation Summary
| Measurement | Thai | West Indian |
| Minimum | 1.0% | 4.0% |
| Maximum | 15.2% | 28.7% |
| Range | 14.2% | 24.7% |
| Mean | 5.2% | 15.8% |
| Median | 4.4% | 15.3% |
| Interquartile 25% (IQ1) | 2.8% | 12.7% |
| Interquartile 75% (IQ3) | 6.3% | 19.4% |
| Interquartile Range (IQR) | 3.5% | 6.7% |
| Standard Deviation (Sample) | 3.1% | 5.7% |
| Standard Deviation (Population) | 3.1% | 5.6% |
Similar Demographics by Receiving Food Stamps
Demographics Similar to Thais by Receiving Food Stamps
In terms of receiving food stamps, the demographic groups most similar to Thais are Iranian (7.9%, a difference of 2.3%), Immigrants from Singapore (8.3%, a difference of 2.3%), Immigrants from Iran (8.3%, a difference of 2.9%), Burmese (8.6%, a difference of 6.6%), and Immigrants from Korea (8.7%, a difference of 6.8%).
| Demographics | Rating | Rank | Receiving Food Stamps |
| Immigrants | Taiwan | 100.0 /100 | #1 | Exceptional 7.3% |
| Immigrants | India | 100.0 /100 | #2 | Exceptional 7.4% |
| Filipinos | 100.0 /100 | #3 | Exceptional 7.4% |
| Iranians | 100.0 /100 | #4 | Exceptional 7.9% |
| Thais | 100.0 /100 | #5 | Exceptional 8.1% |
| Immigrants | Singapore | 100.0 /100 | #6 | Exceptional 8.3% |
| Immigrants | Iran | 100.0 /100 | #7 | Exceptional 8.3% |
| Burmese | 99.9 /100 | #8 | Exceptional 8.6% |
| Immigrants | Korea | 99.9 /100 | #9 | Exceptional 8.7% |
| Immigrants | South Central Asia | 99.9 /100 | #10 | Exceptional 8.8% |
| Okinawans | 99.9 /100 | #11 | Exceptional 8.9% |
| Cypriots | 99.9 /100 | #12 | Exceptional 8.9% |
| Bulgarians | 99.9 /100 | #13 | Exceptional 8.9% |
| Maltese | 99.9 /100 | #14 | Exceptional 8.9% |
| Norwegians | 99.9 /100 | #15 | Exceptional 9.0% |
Demographics Similar to West Indians by Receiving Food Stamps
In terms of receiving food stamps, the demographic groups most similar to West Indians are Nicaraguan (16.1%, a difference of 0.68%), Immigrants from West Indies (16.1%, a difference of 0.77%), Immigrants from the Azores (16.4%, a difference of 0.88%), Jamaican (16.4%, a difference of 0.94%), and Houma (16.5%, a difference of 1.2%).
| Demographics | Rating | Rank | Receiving Food Stamps |
| Immigrants | Bahamas | 0.0 /100 | #297 | Tragic 15.8% |
| Immigrants | Trinidad and Tobago | 0.0 /100 | #298 | Tragic 15.8% |
| Hispanics or Latinos | 0.0 /100 | #299 | Tragic 15.8% |
| Immigrants | Bangladesh | 0.0 /100 | #300 | Tragic 15.9% |
| Trinidadians and Tobagonians | 0.0 /100 | #301 | Tragic 16.0% |
| Immigrants | West Indies | 0.0 /100 | #302 | Tragic 16.1% |
| Nicaraguans | 0.0 /100 | #303 | Tragic 16.1% |
| West Indians | 0.0 /100 | #304 | Tragic 16.3% |
| Immigrants | Azores | 0.0 /100 | #305 | Tragic 16.4% |
| Jamaicans | 0.0 /100 | #306 | Tragic 16.4% |
| Houma | 0.0 /100 | #307 | Tragic 16.5% |
| Barbadians | 0.0 /100 | #308 | Tragic 16.5% |
| U.S. Virgin Islanders | 0.0 /100 | #309 | Tragic 16.5% |
| Immigrants | Barbados | 0.0 /100 | #310 | Tragic 16.6% |
| Guyanese | 0.0 /100 | #311 | Tragic 16.7% |