Immigrants from Argentina vs Colville Child Poverty Under the Age of 5
COMPARE
Immigrants from Argentina
Colville
Child Poverty Under the Age of 5
Child Poverty Under the Age of 5 Comparison
Immigrants from Argentina
Colville
15.4%
CHILD POVERTY UNDER THE AGE OF 5
98.5/ 100
METRIC RATING
75th/ 347
METRIC RANK
25.7%
CHILD POVERTY UNDER THE AGE OF 5
0.0/ 100
METRIC RATING
335th/ 347
METRIC RANK
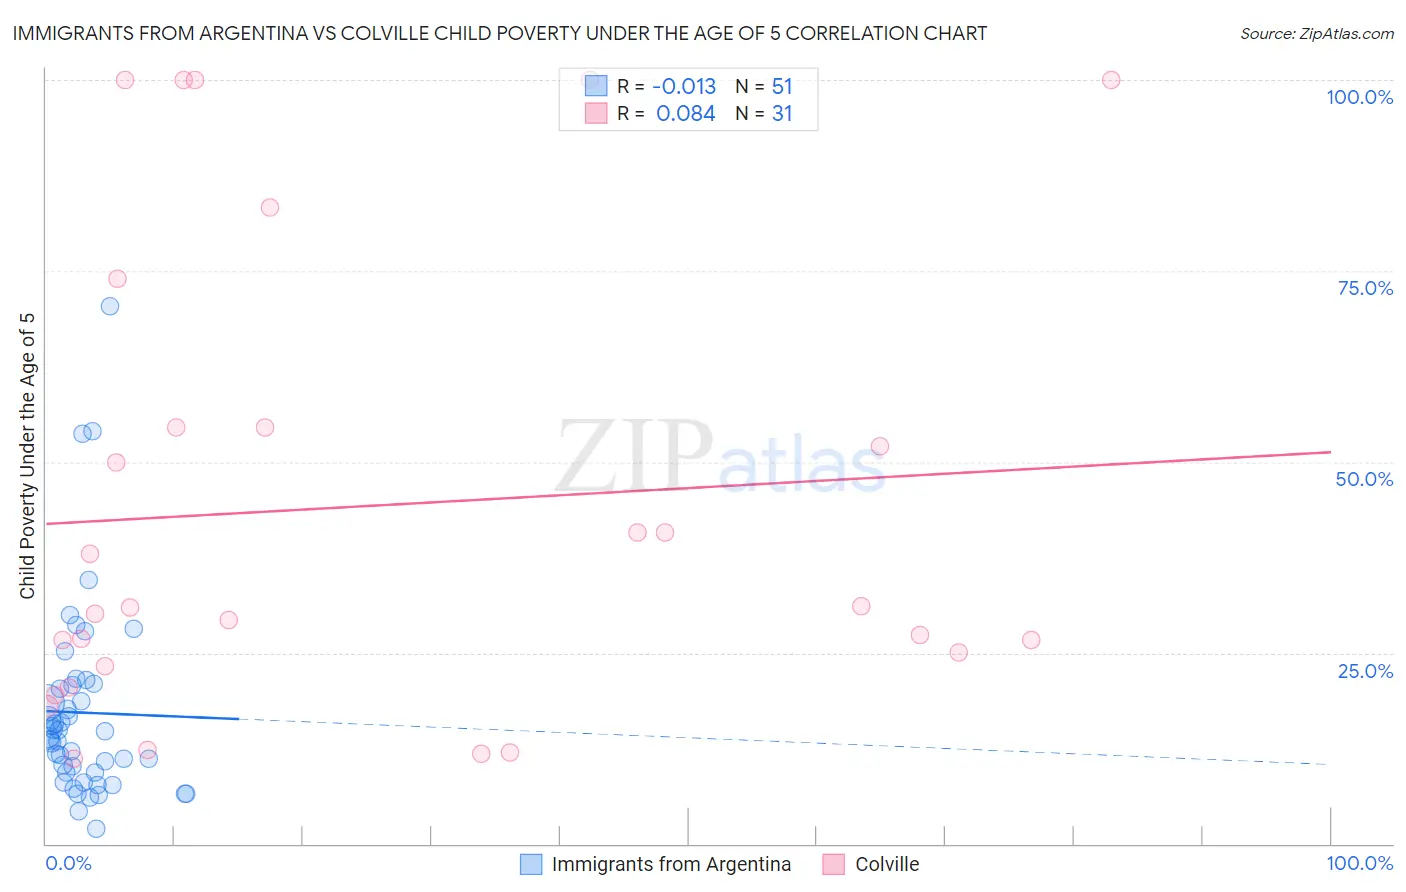
Immigrants from Argentina vs Colville Child Poverty Under the Age of 5 Correlation Chart
The statistical analysis conducted on geographies consisting of 256,145,971 people shows no correlation between the proportion of Immigrants from Argentina and poverty level among children under the age of 5 in the United States with a correlation coefficient (R) of -0.013 and weighted average of 15.4%. Similarly, the statistical analysis conducted on geographies consisting of 34,435,205 people shows a slight positive correlation between the proportion of Colville and poverty level among children under the age of 5 in the United States with a correlation coefficient (R) of 0.084 and weighted average of 25.7%, a difference of 67.0%.
Child Poverty Under the Age of 5 Correlation Summary
| Measurement | Immigrants from Argentina | Colville |
| Minimum | 2.0% | 11.1% |
| Maximum | 70.4% | 100.0% |
| Range | 68.4% | 88.9% |
| Mean | 17.2% | 44.2% |
| Median | 13.9% | 30.9% |
| Interquartile 25% (IQ1) | 9.3% | 23.2% |
| Interquartile 75% (IQ3) | 20.8% | 54.5% |
| Interquartile Range (IQR) | 11.5% | 31.3% |
| Standard Deviation (Sample) | 13.0% | 30.1% |
| Standard Deviation (Population) | 12.9% | 29.6% |
Similar Demographics by Child Poverty Under the Age of 5
Demographics Similar to Immigrants from Argentina by Child Poverty Under the Age of 5
In terms of child poverty under the age of 5, the demographic groups most similar to Immigrants from Argentina are Croatian (15.4%, a difference of 0.0%), Argentinean (15.4%, a difference of 0.15%), Immigrants from Turkey (15.4%, a difference of 0.21%), Immigrants from Ukraine (15.3%, a difference of 0.51%), and Sri Lankan (15.5%, a difference of 0.54%).
| Demographics | Rating | Rank | Child Poverty Under the Age of 5 |
| Zimbabweans | 99.0 /100 | #68 | Exceptional 15.2% |
| Lithuanians | 99.0 /100 | #69 | Exceptional 15.2% |
| Immigrants | Belgium | 98.8 /100 | #70 | Exceptional 15.3% |
| Immigrants | Egypt | 98.8 /100 | #71 | Exceptional 15.3% |
| Immigrants | Sweden | 98.8 /100 | #72 | Exceptional 15.3% |
| Immigrants | Ukraine | 98.7 /100 | #73 | Exceptional 15.3% |
| Argentineans | 98.5 /100 | #74 | Exceptional 15.4% |
| Immigrants | Argentina | 98.5 /100 | #75 | Exceptional 15.4% |
| Croatians | 98.5 /100 | #76 | Exceptional 15.4% |
| Immigrants | Turkey | 98.3 /100 | #77 | Exceptional 15.4% |
| Sri Lankans | 98.1 /100 | #78 | Exceptional 15.5% |
| Australians | 98.0 /100 | #79 | Exceptional 15.5% |
| Italians | 97.9 /100 | #80 | Exceptional 15.5% |
| Czechs | 97.8 /100 | #81 | Exceptional 15.5% |
| Immigrants | Italy | 97.7 /100 | #82 | Exceptional 15.6% |
Demographics Similar to Colville by Child Poverty Under the Age of 5
In terms of child poverty under the age of 5, the demographic groups most similar to Colville are Black/African American (25.7%, a difference of 0.0%), Native/Alaskan (25.6%, a difference of 0.50%), Apache (25.0%, a difference of 2.8%), Sioux (26.9%, a difference of 4.9%), and Kiowa (24.5%, a difference of 5.0%).
| Demographics | Rating | Rank | Child Poverty Under the Age of 5 |
| Immigrants | Dominican Republic | 0.0 /100 | #328 | Tragic 24.1% |
| Cajuns | 0.0 /100 | #329 | Tragic 24.1% |
| Creek | 0.0 /100 | #330 | Tragic 24.2% |
| Kiowa | 0.0 /100 | #331 | Tragic 24.5% |
| Apache | 0.0 /100 | #332 | Tragic 25.0% |
| Natives/Alaskans | 0.0 /100 | #333 | Tragic 25.6% |
| Blacks/African Americans | 0.0 /100 | #334 | Tragic 25.7% |
| Colville | 0.0 /100 | #335 | Tragic 25.7% |
| Sioux | 0.0 /100 | #336 | Tragic 26.9% |
| Pima | 0.0 /100 | #337 | Tragic 27.4% |
| Hopi | 0.0 /100 | #338 | Tragic 27.7% |
| Yup'ik | 0.0 /100 | #339 | Tragic 27.7% |
| Cheyenne | 0.0 /100 | #340 | Tragic 28.3% |
| Immigrants | Yemen | 0.0 /100 | #341 | Tragic 29.3% |
| Tohono O'odham | 0.0 /100 | #342 | Tragic 29.5% |