Alaskan Athabascan vs Immigrants from Hungary Male Poverty
COMPARE
Alaskan Athabascan
Immigrants from Hungary
Male Poverty
Male Poverty Comparison
Alaskan Athabascans
Immigrants from Hungary
12.8%
MALE POVERTY
0.3/ 100
METRIC RATING
243rd/ 347
METRIC RANK
10.7%
MALE POVERTY
87.6/ 100
METRIC RATING
119th/ 347
METRIC RANK
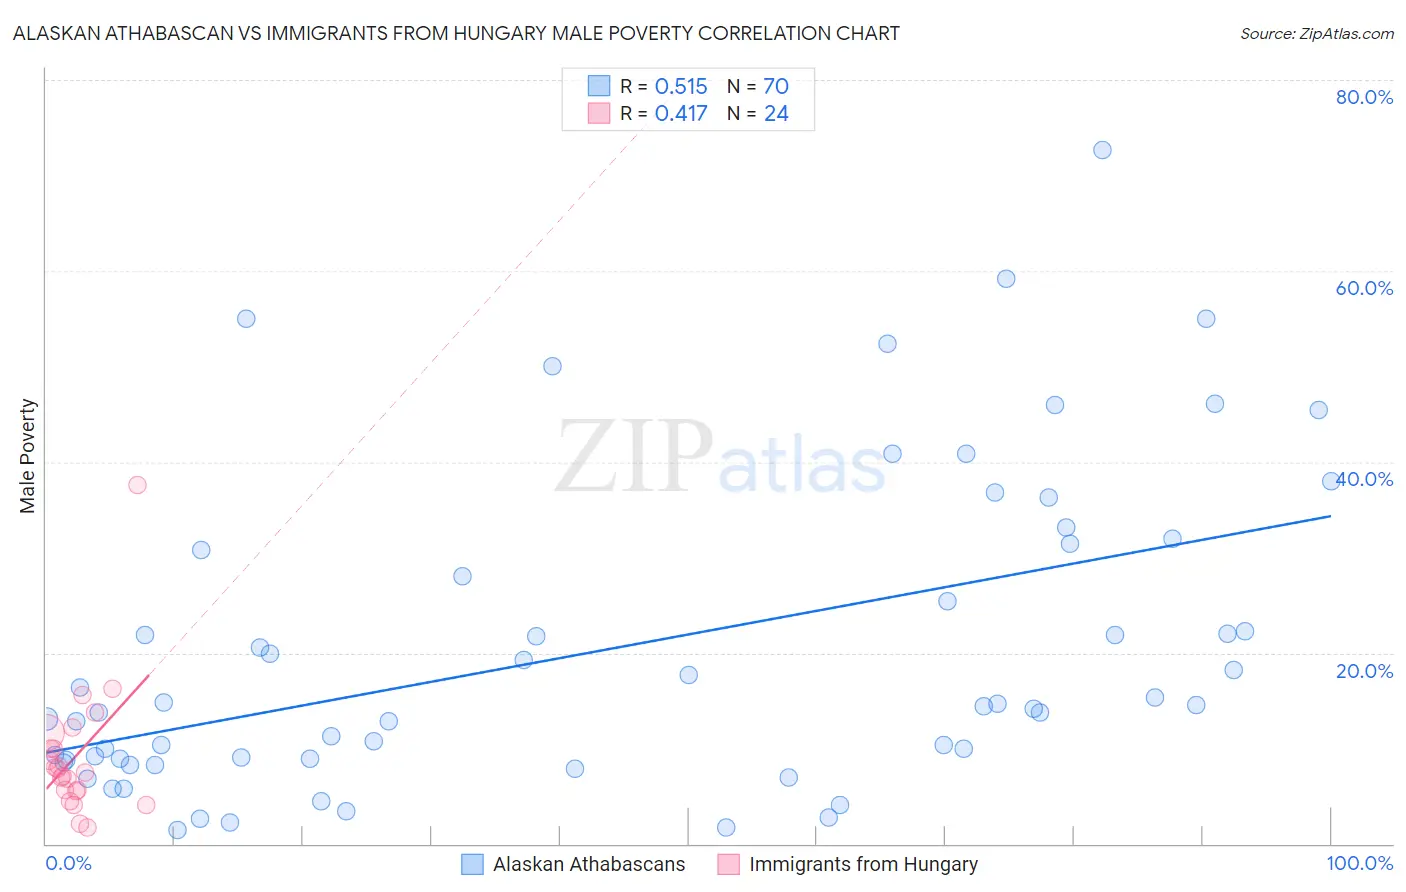
Alaskan Athabascan vs Immigrants from Hungary Male Poverty Correlation Chart
The statistical analysis conducted on geographies consisting of 45,812,962 people shows a substantial positive correlation between the proportion of Alaskan Athabascans and poverty level among males in the United States with a correlation coefficient (R) of 0.515 and weighted average of 12.8%. Similarly, the statistical analysis conducted on geographies consisting of 195,630,615 people shows a moderate positive correlation between the proportion of Immigrants from Hungary and poverty level among males in the United States with a correlation coefficient (R) of 0.417 and weighted average of 10.7%, a difference of 20.1%.
Male Poverty Correlation Summary
| Measurement | Alaskan Athabascan | Immigrants from Hungary |
| Minimum | 1.4% | 1.8% |
| Maximum | 72.7% | 37.5% |
| Range | 71.3% | 35.8% |
| Mean | 20.4% | 9.2% |
| Median | 14.5% | 7.6% |
| Interquartile 25% (IQ1) | 8.9% | 5.6% |
| Interquartile 75% (IQ3) | 30.8% | 10.9% |
| Interquartile Range (IQR) | 22.0% | 5.3% |
| Standard Deviation (Sample) | 16.4% | 7.1% |
| Standard Deviation (Population) | 16.2% | 7.0% |
Similar Demographics by Male Poverty
Demographics Similar to Alaskan Athabascans by Male Poverty
In terms of male poverty, the demographic groups most similar to Alaskan Athabascans are Nepalese (12.8%, a difference of 0.040%), Tsimshian (12.8%, a difference of 0.11%), Liberian (12.8%, a difference of 0.12%), Sudanese (12.8%, a difference of 0.20%), and Immigrants from El Salvador (12.8%, a difference of 0.42%).
| Demographics | Rating | Rank | Male Poverty |
| Immigrants | Saudi Arabia | 0.4 /100 | #236 | Tragic 12.7% |
| French American Indians | 0.4 /100 | #237 | Tragic 12.7% |
| Ecuadorians | 0.4 /100 | #238 | Tragic 12.7% |
| Ghanaians | 0.4 /100 | #239 | Tragic 12.7% |
| Immigrants | Middle Africa | 0.4 /100 | #240 | Tragic 12.7% |
| Sudanese | 0.3 /100 | #241 | Tragic 12.8% |
| Nepalese | 0.3 /100 | #242 | Tragic 12.8% |
| Alaskan Athabascans | 0.3 /100 | #243 | Tragic 12.8% |
| Tsimshian | 0.3 /100 | #244 | Tragic 12.8% |
| Liberians | 0.3 /100 | #245 | Tragic 12.8% |
| Immigrants | El Salvador | 0.2 /100 | #246 | Tragic 12.8% |
| Immigrants | Western Africa | 0.2 /100 | #247 | Tragic 12.9% |
| Immigrants | Sudan | 0.2 /100 | #248 | Tragic 12.9% |
| Potawatomi | 0.2 /100 | #249 | Tragic 12.9% |
| Immigrants | Nicaragua | 0.2 /100 | #250 | Tragic 12.9% |
Demographics Similar to Immigrants from Hungary by Male Poverty
In terms of male poverty, the demographic groups most similar to Immigrants from Hungary are Okinawan (10.7%, a difference of 0.010%), Immigrants from China (10.7%, a difference of 0.10%), Peruvian (10.7%, a difference of 0.11%), Immigrants from South Eastern Asia (10.6%, a difference of 0.12%), and Sri Lankan (10.6%, a difference of 0.13%).
| Demographics | Rating | Rank | Male Poverty |
| Immigrants | Turkey | 89.5 /100 | #112 | Excellent 10.6% |
| Palestinians | 89.1 /100 | #113 | Excellent 10.6% |
| Immigrants | Brazil | 89.0 /100 | #114 | Excellent 10.6% |
| Immigrants | Russia | 88.6 /100 | #115 | Excellent 10.6% |
| Sri Lankans | 88.1 /100 | #116 | Excellent 10.6% |
| Immigrants | South Eastern Asia | 88.1 /100 | #117 | Excellent 10.6% |
| Okinawans | 87.6 /100 | #118 | Excellent 10.7% |
| Immigrants | Hungary | 87.6 /100 | #119 | Excellent 10.7% |
| Immigrants | China | 87.1 /100 | #120 | Excellent 10.7% |
| Peruvians | 87.1 /100 | #121 | Excellent 10.7% |
| Native Hawaiians | 87.0 /100 | #122 | Excellent 10.7% |
| South Africans | 86.8 /100 | #123 | Excellent 10.7% |
| French | 86.7 /100 | #124 | Excellent 10.7% |
| Immigrants | Norway | 86.0 /100 | #125 | Excellent 10.7% |
| Immigrants | Ukraine | 84.3 /100 | #126 | Excellent 10.7% |