Zip Codes with the Highest Percentage of Population Employed in Agriculture, Fishing & Hunting in Williamsport, PA
RELATED REPORTS & OPTIONS
Agriculture, Fishing & Hunting
Williamsport
Compare Zip Codes
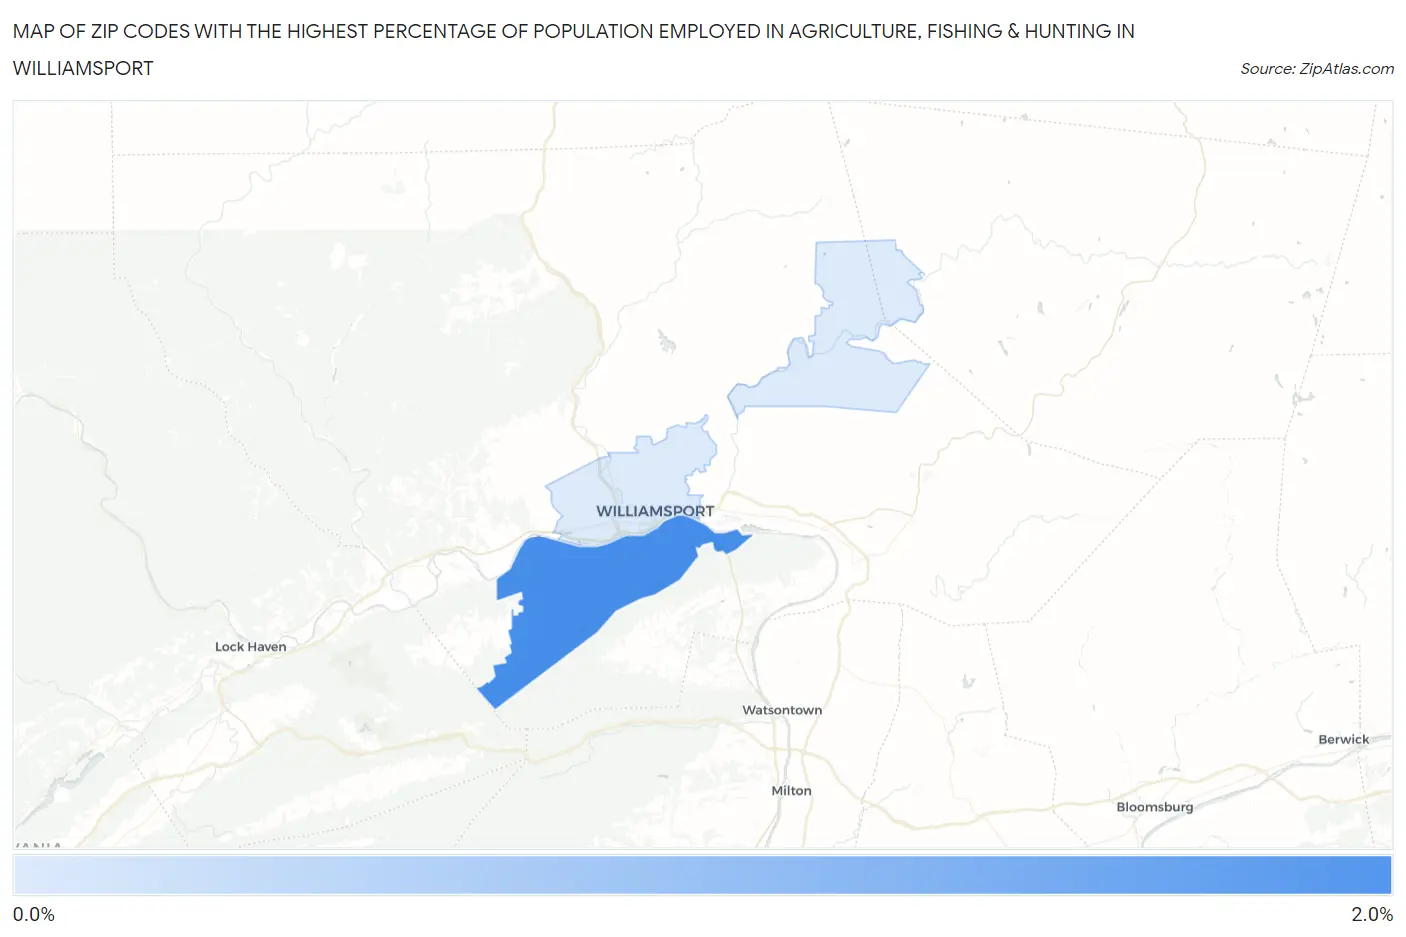
Map of Zip Codes with the Highest Percentage of Population Employed in Agriculture, Fishing & Hunting in Williamsport
0.0%
2.0%
Zip Codes with the Highest Percentage of Population Employed in Agriculture, Fishing & Hunting in Williamsport, PA
| Zip Code | % Employed | vs State | vs National | |
| 1. | 17702 | 1.5% | 0.87%(+0.659)#501 | 1.2%(+0.327)#14,208 |
| 2. | 17701 | 0.12% | 0.87%(-0.745)#1,022 | 1.2%(-1.08)#23,383 |
1
Common Questions
What are the Top Zip Codes with the Highest Percentage of Population Employed in Agriculture, Fishing & Hunting in Williamsport, PA?
Top Zip Codes with the Highest Percentage of Population Employed in Agriculture, Fishing & Hunting in Williamsport, PA are:
What zip code has the Highest Percentage of Population Employed in Agriculture, Fishing & Hunting in Williamsport, PA?
17702 has the Highest Percentage of Population Employed in Agriculture, Fishing & Hunting in Williamsport, PA with 1.5%.
What is the Percentage of Population Employed in Agriculture, Fishing & Hunting in Williamsport, PA?
Percentage of Population Employed in Agriculture, Fishing & Hunting in Williamsport is 0.079%.
What is the Percentage of Population Employed in Agriculture, Fishing & Hunting in Pennsylvania?
Percentage of Population Employed in Agriculture, Fishing & Hunting in Pennsylvania is 0.87%.
What is the Percentage of Population Employed in Agriculture, Fishing & Hunting in the United States?
Percentage of Population Employed in Agriculture, Fishing & Hunting in the United States is 1.2%.