Zip Codes with the Highest Percentage of Population Employed in Agriculture, Fishing & Hunting in West Chester, PA
RELATED REPORTS & OPTIONS
Agriculture, Fishing & Hunting
West Chester
Compare Zip Codes
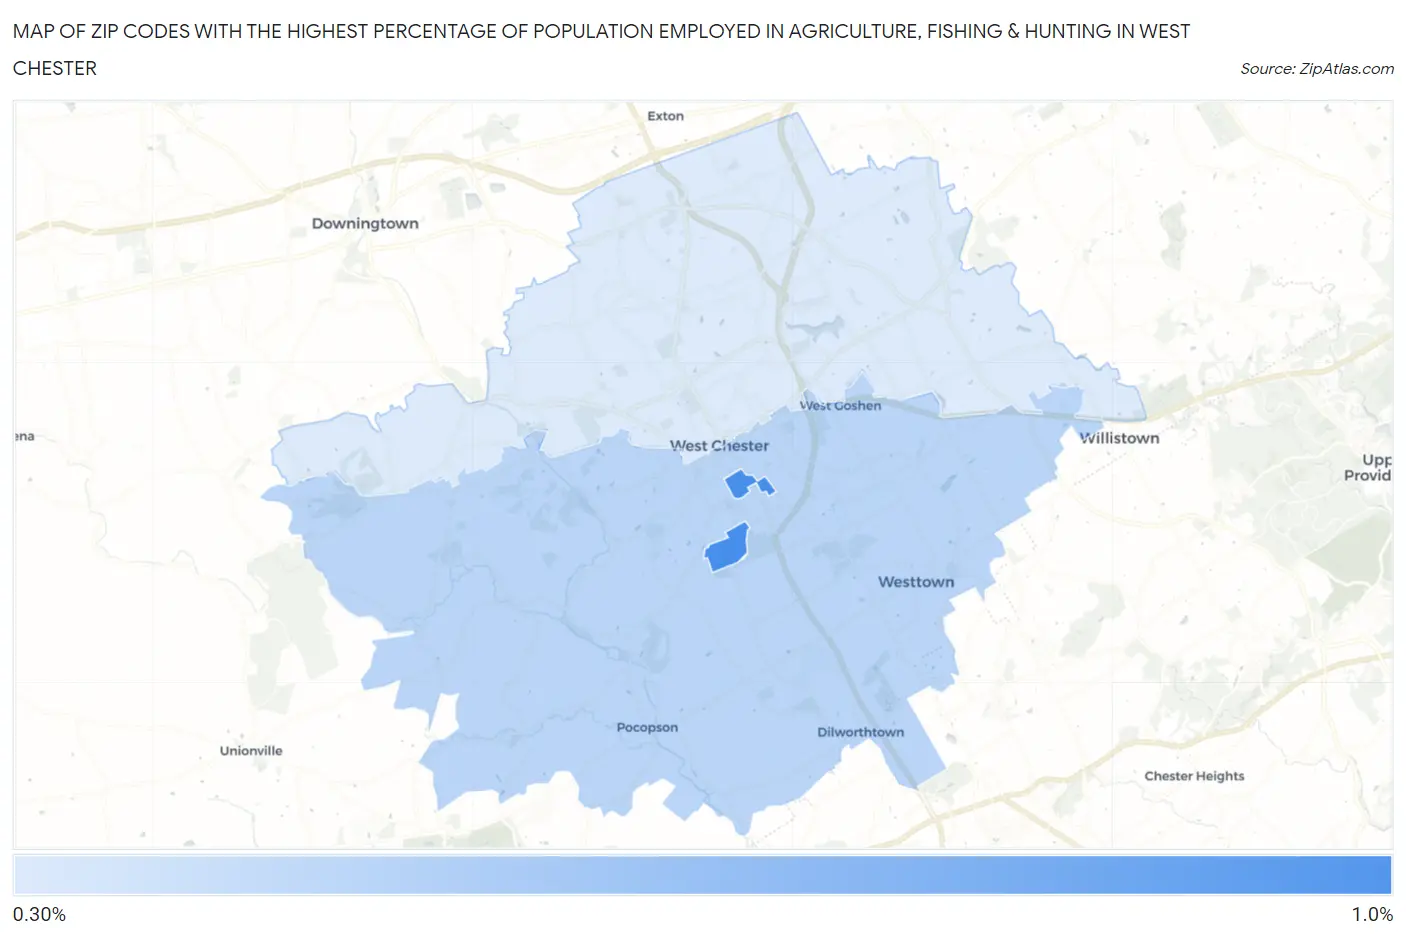
Map of Zip Codes with the Highest Percentage of Population Employed in Agriculture, Fishing & Hunting in West Chester
0.0%
1.0%
Zip Codes with the Highest Percentage of Population Employed in Agriculture, Fishing & Hunting in West Chester, PA
| Zip Code | % Employed | vs State | vs National | |
| 1. | 19383 | 0.99% | 0.87%(+0.127)#615 | 1.2%(-0.205)#16,251 |
| 2. | 19382 | 0.50% | 0.87%(-0.365)#795 | 1.2%(-0.697)#19,259 |
| 3. | 19380 | 0.35% | 0.87%(-0.515)#874 | 1.2%(-0.848)#20,630 |
1
Common Questions
What are the Top Zip Codes with the Highest Percentage of Population Employed in Agriculture, Fishing & Hunting in West Chester, PA?
Top Zip Codes with the Highest Percentage of Population Employed in Agriculture, Fishing & Hunting in West Chester, PA are:
What zip code has the Highest Percentage of Population Employed in Agriculture, Fishing & Hunting in West Chester, PA?
19383 has the Highest Percentage of Population Employed in Agriculture, Fishing & Hunting in West Chester, PA with 0.99%.
What is the Percentage of Population Employed in Agriculture, Fishing & Hunting in Pennsylvania?
Percentage of Population Employed in Agriculture, Fishing & Hunting in Pennsylvania is 0.87%.
What is the Percentage of Population Employed in Agriculture, Fishing & Hunting in the United States?
Percentage of Population Employed in Agriculture, Fishing & Hunting in the United States is 1.2%.