Zip Codes with the Highest Percentage of Population Employed in Arts, Entertainment & Recreation in State College, PA
RELATED REPORTS & OPTIONS
Arts, Entertainment & Recreation
State College
Compare Zip Codes
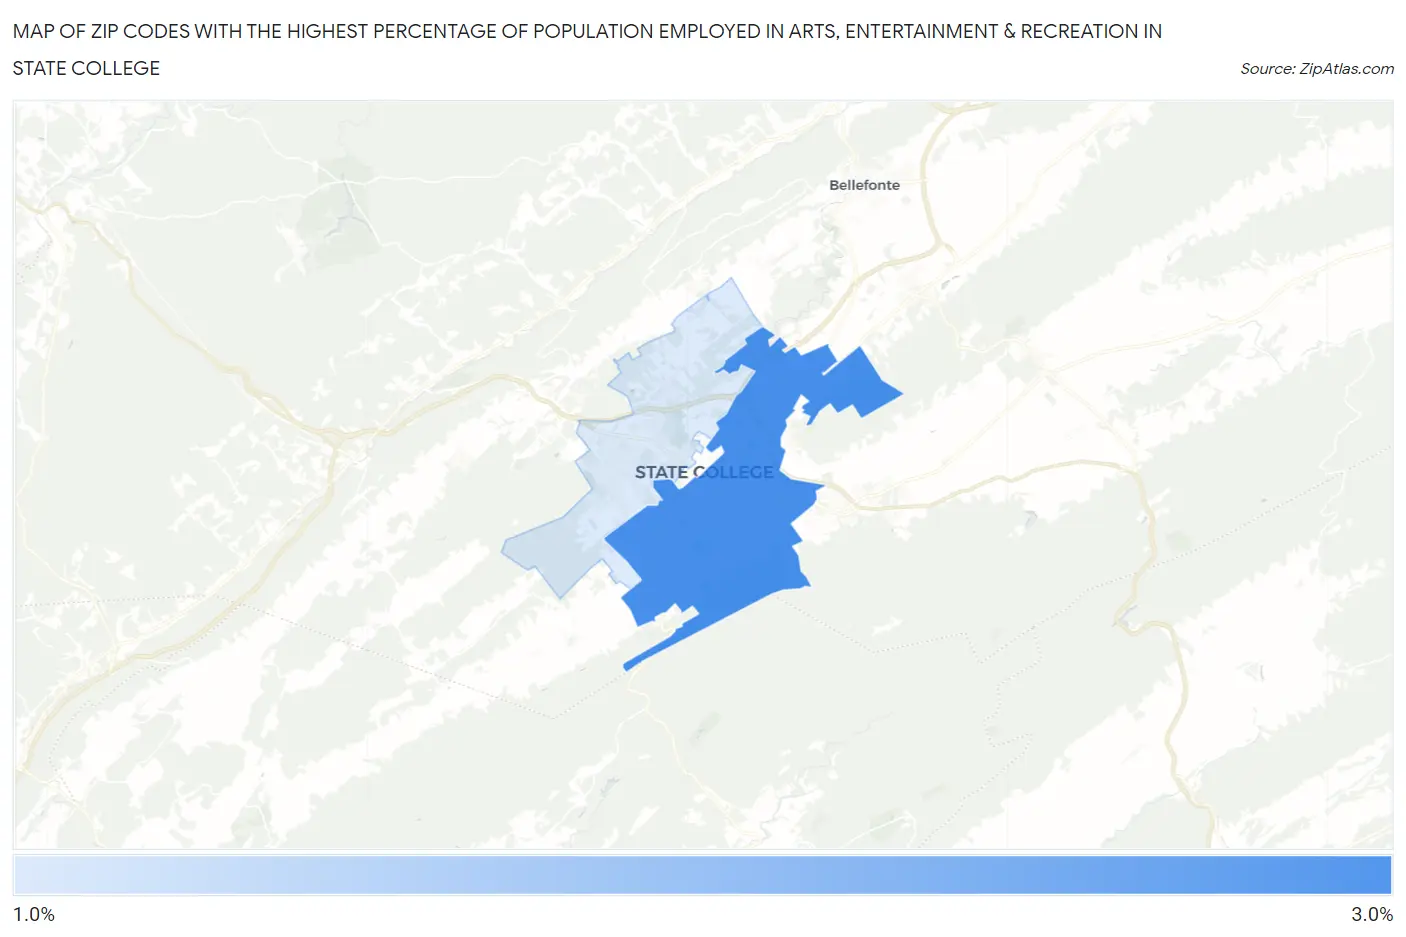
Map of Zip Codes with the Highest Percentage of Population Employed in Arts, Entertainment & Recreation in State College
0.0%
3.0%
Zip Codes with the Highest Percentage of Population Employed in Arts, Entertainment & Recreation in State College, PA
| Zip Code | % Employed | vs State | vs National | |
| 1. | 16801 | 2.7% | 1.8%(+0.931)#239 | 2.1%(+0.648)#6,250 |
| 2. | 16803 | 1.6% | 1.8%(-0.188)#580 | 2.1%(-0.471)#12,376 |
1
Common Questions
What are the Top Zip Codes with the Highest Percentage of Population Employed in Arts, Entertainment & Recreation in State College, PA?
Top Zip Codes with the Highest Percentage of Population Employed in Arts, Entertainment & Recreation in State College, PA are:
What zip code has the Highest Percentage of Population Employed in Arts, Entertainment & Recreation in State College, PA?
16801 has the Highest Percentage of Population Employed in Arts, Entertainment & Recreation in State College, PA with 2.7%.
What is the Percentage of Population Employed in Arts, Entertainment & Recreation in Pennsylvania?
Percentage of Population Employed in Arts, Entertainment & Recreation in Pennsylvania is 1.8%.
What is the Percentage of Population Employed in Arts, Entertainment & Recreation in the United States?
Percentage of Population Employed in Arts, Entertainment & Recreation in the United States is 2.1%.