Zip Codes with the Highest Percentage of Population Employed in Health Care & Social Assistance in Philadelphia, PA
RELATED REPORTS & OPTIONS
Health Care & Social Assistance
Philadelphia
Compare Zip Codes
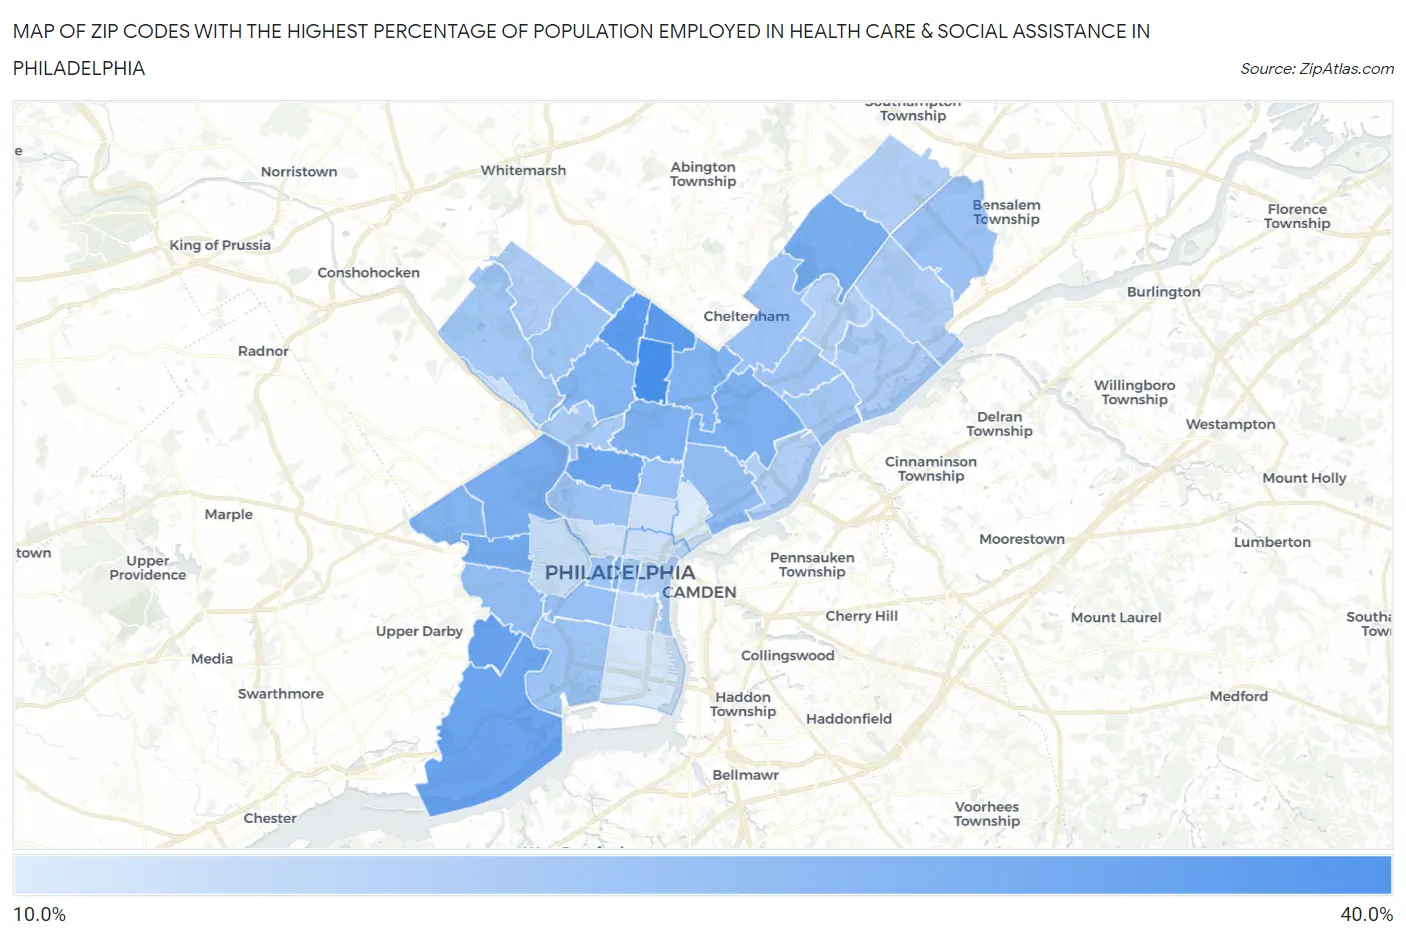
Map of Zip Codes with the Highest Percentage of Population Employed in Health Care & Social Assistance in Philadelphia
0.0%
40.0%
Zip Codes with the Highest Percentage of Population Employed in Health Care & Social Assistance in Philadelphia, PA
| Zip Code | % Employed | vs State | vs National | |
| 1. | 19141 | 33.9% | 16.8%(+17.1)#59 | 13.9%(+19.9)#661 |
| 2. | 19138 | 31.1% | 16.8%(+14.3)#70 | 13.9%(+17.1)#841 |
| 3. | 19126 | 31.0% | 16.8%(+14.2)#72 | 13.9%(+17.0)#858 |
| 4. | 19108 | 29.0% | 16.8%(+12.2)#92 | 13.9%(+15.0)#1,052 |
| 5. | 19142 | 28.9% | 16.8%(+12.1)#94 | 13.9%(+15.0)#1,062 |
| 6. | 19153 | 28.4% | 16.8%(+11.6)#102 | 13.9%(+14.5)#1,129 |
| 7. | 19132 | 28.1% | 16.8%(+11.3)#104 | 13.9%(+14.2)#1,162 |
| 8. | 19139 | 27.2% | 16.8%(+10.4)#120 | 13.9%(+13.2)#1,315 |
| 9. | 19115 | 26.5% | 16.8%(+9.71)#132 | 13.9%(+12.5)#1,430 |
| 10. | 19131 | 26.3% | 16.8%(+9.54)#138 | 13.9%(+12.4)#1,463 |
| 11. | 19124 | 26.0% | 16.8%(+9.18)#142 | 13.9%(+12.0)#1,527 |
| 12. | 19140 | 25.8% | 16.8%(+9.04)#143 | 13.9%(+11.9)#1,552 |
| 13. | 19102 | 25.3% | 16.8%(+8.53)#153 | 13.9%(+11.4)#1,662 |
| 14. | 19120 | 25.1% | 16.8%(+8.29)#155 | 13.9%(+11.1)#1,701 |
| 15. | 19151 | 24.8% | 16.8%(+8.03)#165 | 13.9%(+10.9)#1,777 |
| 16. | 19144 | 24.6% | 16.8%(+7.81)#173 | 13.9%(+10.6)#1,836 |
| 17. | 19150 | 23.4% | 16.8%(+6.61)#199 | 13.9%(+9.45)#2,184 |
| 18. | 19134 | 22.9% | 16.8%(+6.16)#218 | 13.9%(+9.00)#2,371 |
| 19. | 19143 | 22.8% | 16.8%(+6.00)#223 | 13.9%(+8.84)#2,420 |
| 20. | 19133 | 22.0% | 16.8%(+5.21)#267 | 13.9%(+8.05)#2,806 |
| 21. | 19146 | 21.8% | 16.8%(+5.00)#276 | 13.9%(+7.84)#2,917 |
| 22. | 19121 | 21.6% | 16.8%(+4.87)#284 | 13.9%(+7.71)#2,986 |
| 23. | 19111 | 21.4% | 16.8%(+4.67)#293 | 13.9%(+7.51)#3,091 |
| 24. | 19154 | 21.3% | 16.8%(+4.50)#299 | 13.9%(+7.34)#3,182 |
| 25. | 19119 | 20.8% | 16.8%(+4.04)#328 | 13.9%(+6.88)#3,500 |
| 26. | 19145 | 20.8% | 16.8%(+4.01)#332 | 13.9%(+6.85)#3,518 |
| 27. | 19149 | 20.6% | 16.8%(+3.86)#346 | 13.9%(+6.70)#3,634 |
| 28. | 19103 | 20.5% | 16.8%(+3.77)#353 | 13.9%(+6.61)#3,682 |
| 29. | 19135 | 20.3% | 16.8%(+3.48)#368 | 13.9%(+6.32)#3,892 |
| 30. | 19128 | 20.2% | 16.8%(+3.39)#381 | 13.9%(+6.23)#3,956 |
| 31. | 19107 | 20.0% | 16.8%(+3.20)#397 | 13.9%(+6.04)#4,122 |
| 32. | 19129 | 19.8% | 16.8%(+3.04)#405 | 13.9%(+5.88)#4,221 |
| 33. | 19136 | 19.3% | 16.8%(+2.51)#457 | 13.9%(+5.35)#4,720 |
| 34. | 19114 | 19.0% | 16.8%(+2.20)#483 | 13.9%(+5.04)#5,018 |
| 35. | 19118 | 18.9% | 16.8%(+2.10)#490 | 13.9%(+4.94)#5,116 |
| 36. | 19116 | 18.6% | 16.8%(+1.81)#522 | 13.9%(+4.65)#5,446 |
| 37. | 19137 | 18.3% | 16.8%(+1.55)#558 | 13.9%(+4.39)#5,769 |
| 38. | 19152 | 18.2% | 16.8%(+1.42)#567 | 13.9%(+4.26)#5,939 |
| 39. | 19106 | 18.1% | 16.8%(+1.31)#579 | 13.9%(+4.15)#6,070 |
| 40. | 19147 | 16.8% | 16.8%(+0.009)#730 | 13.9%(+2.85)#8,073 |
| 41. | 19104 | 15.6% | 16.8%(-1.14)#877 | 13.9%(+1.70)#10,232 |
| 42. | 19127 | 14.8% | 16.8%(-1.97)#973 | 13.9%(+0.871)#12,091 |
| 43. | 19123 | 14.7% | 16.8%(-2.06)#983 | 13.9%(+0.783)#12,291 |
| 44. | 19130 | 14.6% | 16.8%(-2.13)#996 | 13.9%(+0.705)#12,505 |
| 45. | 19122 | 14.5% | 16.8%(-2.31)#1,015 | 13.9%(+0.530)#12,932 |
| 46. | 19148 | 13.5% | 16.8%(-3.28)#1,131 | 13.9%(-0.440)#15,290 |
| 47. | 19125 | 12.5% | 16.8%(-4.24)#1,241 | 13.9%(-1.40)#17,762 |
1
Common Questions
What are the Top 10 Zip Codes with the Highest Percentage of Population Employed in Health Care & Social Assistance in Philadelphia, PA?
Top 10 Zip Codes with the Highest Percentage of Population Employed in Health Care & Social Assistance in Philadelphia, PA are:
What zip code has the Highest Percentage of Population Employed in Health Care & Social Assistance in Philadelphia, PA?
19141 has the Highest Percentage of Population Employed in Health Care & Social Assistance in Philadelphia, PA with 33.9%.
What is the Percentage of Population Employed in Health Care & Social Assistance in Philadelphia, PA?
Percentage of Population Employed in Health Care & Social Assistance in Philadelphia is 21.6%.
What is the Percentage of Population Employed in Health Care & Social Assistance in Pennsylvania?
Percentage of Population Employed in Health Care & Social Assistance in Pennsylvania is 16.8%.
What is the Percentage of Population Employed in Health Care & Social Assistance in the United States?
Percentage of Population Employed in Health Care & Social Assistance in the United States is 13.9%.