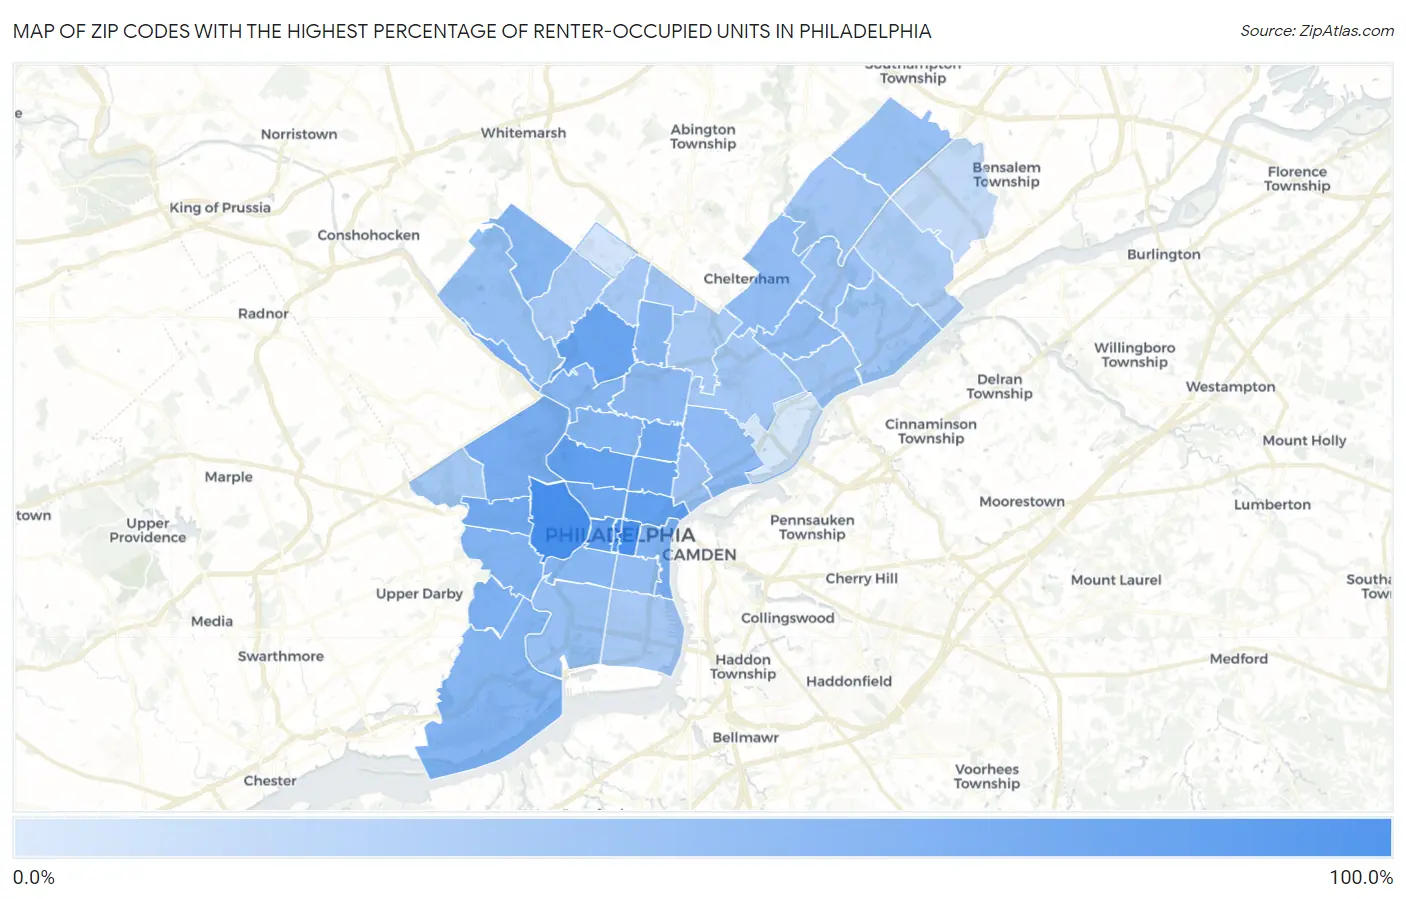
Zip Codes with the Highest Percentage of Renter-Occupied Units in Philadelphia, PA
RELATED REPORTS & OPTIONS
Highest Renter-Occupied
Philadelphia
Compare Zip Codes
Map of Zip Codes with the Highest Percentage of Renter-Occupied Units in Philadelphia
0.0%
100.0%
Zip Codes with the Highest Percentage of Renter-Occupied Units in Philadelphia, PA
| Zip Code | % Renter-Occupied | vs State | vs National | |
| 1. | 19107 | 81.5% | 30.8%(+50.7)#21 | 35.2%(+46.3)#633 |
| 2. | 19104 | 81.0% | 30.8%(+50.2)#22 | 35.2%(+45.8)#646 |
| 3. | 19102 | 76.9% | 30.8%(+46.1)#27 | 35.2%(+41.7)#776 |
| 4. | 19103 | 69.7% | 30.8%(+38.9)#41 | 35.2%(+34.5)#1,080 |
| 5. | 19123 | 67.1% | 30.8%(+36.2)#45 | 35.2%(+31.9)#1,235 |
| 6. | 19121 | 66.8% | 30.8%(+35.9)#47 | 35.2%(+31.6)#1,247 |
| 7. | 19144 | 63.4% | 30.8%(+32.5)#55 | 35.2%(+28.2)#1,522 |
| 8. | 19130 | 61.5% | 30.8%(+30.7)#62 | 35.2%(+26.3)#1,676 |
| 9. | 19122 | 61.5% | 30.8%(+30.7)#63 | 35.2%(+26.3)#1,679 |
| 10. | 19139 | 60.3% | 30.8%(+29.5)#68 | 35.2%(+25.1)#1,772 |
| 11. | 19133 | 58.9% | 30.8%(+28.1)#74 | 35.2%(+23.7)#1,905 |
| 12. | 19131 | 56.0% | 30.8%(+25.2)#85 | 35.2%(+20.8)#2,204 |
| 13. | 19127 | 54.6% | 30.8%(+23.8)#93 | 35.2%(+19.4)#2,385 |
| 14. | 19142 | 53.4% | 30.8%(+22.6)#99 | 35.2%(+18.2)#2,555 |
| 15. | 19106 | 52.2% | 30.8%(+21.4)#106 | 35.2%(+17.1)#2,735 |
| 16. | 19143 | 52.2% | 30.8%(+21.4)#107 | 35.2%(+17.0)#2,738 |
| 17. | 19132 | 50.6% | 30.8%(+19.8)#118 | 35.2%(+15.4)#2,991 |
| 18. | 19153 | 50.2% | 30.8%(+19.4)#123 | 35.2%(+15.0)#3,050 |
| 19. | 19129 | 50.1% | 30.8%(+19.3)#124 | 35.2%(+14.9)#3,071 |
| 20. | 19118 | 49.4% | 30.8%(+18.6)#126 | 35.2%(+14.3)#3,187 |
| 21. | 19141 | 49.2% | 30.8%(+18.4)#128 | 35.2%(+14.1)#3,217 |
| 22. | 19146 | 48.9% | 30.8%(+18.1)#129 | 35.2%(+13.7)#3,290 |
| 23. | 19140 | 46.9% | 30.8%(+16.1)#142 | 35.2%(+11.7)#3,653 |
| 24. | 19134 | 46.0% | 30.8%(+15.2)#151 | 35.2%(+10.8)#3,849 |
| 25. | 19111 | 45.1% | 30.8%(+14.3)#159 | 35.2%(+9.90)#4,036 |
| 26. | 19149 | 44.6% | 30.8%(+13.7)#165 | 35.2%(+9.37)#4,172 |
| 27. | 19147 | 43.3% | 30.8%(+12.5)#180 | 35.2%(+8.11)#4,501 |
| 28. | 19128 | 43.2% | 30.8%(+12.4)#183 | 35.2%(+8.04)#4,524 |
| 29. | 19116 | 42.2% | 30.8%(+11.4)#192 | 35.2%(+6.99)#4,790 |
| 30. | 19145 | 41.4% | 30.8%(+10.6)#204 | 35.2%(+6.20)#4,999 |
| 31. | 19125 | 40.9% | 30.8%(+10.1)#207 | 35.2%(+5.74)#5,140 |
| 32. | 19152 | 40.4% | 30.8%(+9.54)#210 | 35.2%(+5.17)#5,301 |
| 33. | 19136 | 38.9% | 30.8%(+8.06)#228 | 35.2%(+3.68)#5,770 |
| 34. | 19135 | 38.8% | 30.8%(+7.99)#230 | 35.2%(+3.62)#5,796 |
| 35. | 19126 | 37.9% | 30.8%(+7.12)#243 | 35.2%(+2.75)#6,122 |
| 36. | 19115 | 37.4% | 30.8%(+6.62)#251 | 35.2%(+2.25)#6,294 |
| 37. | 19151 | 37.1% | 30.8%(+6.26)#261 | 35.2%(+1.89)#6,448 |
| 38. | 19124 | 36.5% | 30.8%(+5.65)#276 | 35.2%(+1.27)#6,734 |
| 39. | 19138 | 35.7% | 30.8%(+4.93)#294 | 35.2%(+0.561)#7,009 |
| 40. | 19148 | 35.4% | 30.8%(+4.63)#299 | 35.2%(+0.255)#7,150 |
| 41. | 19119 | 35.4% | 30.8%(+4.61)#301 | 35.2%(+0.234)#7,155 |
| 42. | 19120 | 34.9% | 30.8%(+4.13)#313 | 35.2%(-0.239)#7,385 |
| 43. | 19114 | 32.9% | 30.8%(+2.10)#351 | 35.2%(-2.27)#8,365 |
| 44. | 19154 | 24.4% | 30.8%(-6.39)#676 | 35.2%(-10.8)#14,148 |
| 45. | 19150 | 19.2% | 30.8%(-11.6)#948 | 35.2%(-16.0)#19,018 |
| 46. | 19137 | 17.3% | 30.8%(-13.5)#1,070 | 35.2%(-17.9)#20,883 |
| 47. | 19108 | 14.7% | 30.8%(-16.1)#1,234 | 35.2%(-20.5)#23,410 |
1
Common Questions
What are the Top 10 Zip Codes with the Highest Percentage of Renter-Occupied Units in Philadelphia, PA?
Top 10 Zip Codes with the Highest Percentage of Renter-Occupied Units in Philadelphia, PA are:
What zip code has the Highest Percentage of Renter-Occupied Units in Philadelphia, PA?
19107 has the Highest Percentage of Renter-Occupied Units in Philadelphia, PA with 81.5%.
What is the Percentage of Renter-Occupied Units in Philadelphia, PA?
Percentage of Renter-Occupied Units in Philadelphia is 47.8%.
What is the Percentage of Renter-Occupied Units in Pennsylvania?
Percentage of Renter-Occupied Units in Pennsylvania is 30.8%.
What is the Percentage of Renter-Occupied Units in the United States?
Percentage of Renter-Occupied Units in the United States is 35.2%.