Zip Codes with the Highest Percentage of Population Employed in Farming, Fishing & Forestry in Norristown, PA
RELATED REPORTS & OPTIONS
Farming, Fishing & Forestry
Norristown
Compare Zip Codes
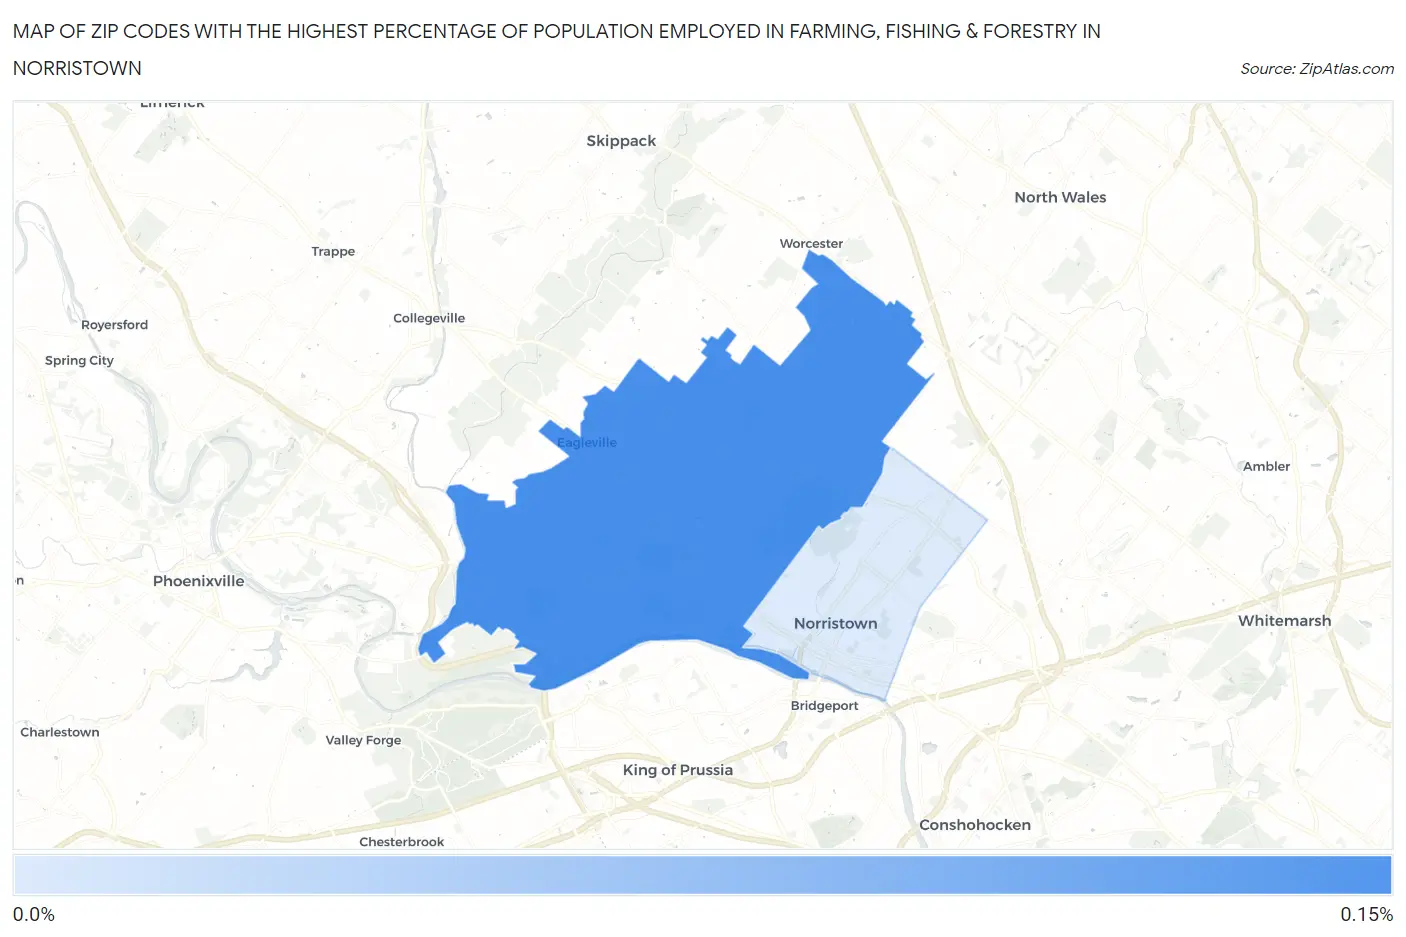
Map of Zip Codes with the Highest Percentage of Population Employed in Farming, Fishing & Forestry in Norristown
0.0%
0.15%
Zip Codes with the Highest Percentage of Population Employed in Farming, Fishing & Forestry in Norristown, PA
| Zip Code | % Employed | vs State | vs National | |
| 1. | 19403 | 0.15% | 0.41%(-0.259)#728 | 0.61%(-0.459)#16,981 |
| 2. | 19401 | 0.0046% | 0.41%(-0.401)#846 | 0.61%(-0.601)#19,206 |
1
Common Questions
What are the Top Zip Codes with the Highest Percentage of Population Employed in Farming, Fishing & Forestry in Norristown, PA?
Top Zip Codes with the Highest Percentage of Population Employed in Farming, Fishing & Forestry in Norristown, PA are:
What zip code has the Highest Percentage of Population Employed in Farming, Fishing & Forestry in Norristown, PA?
19403 has the Highest Percentage of Population Employed in Farming, Fishing & Forestry in Norristown, PA with 0.15%.
What is the Percentage of Population Employed in Farming, Fishing & Forestry in Pennsylvania?
Percentage of Population Employed in Farming, Fishing & Forestry in Pennsylvania is 0.41%.
What is the Percentage of Population Employed in Farming, Fishing & Forestry in the United States?
Percentage of Population Employed in Farming, Fishing & Forestry in the United States is 0.61%.