Zip Codes with the Highest Percentage of Renter-Occupied Units in Mckeesport, PA
RELATED REPORTS & OPTIONS
Highest Renter-Occupied
Mckeesport
Compare Zip Codes
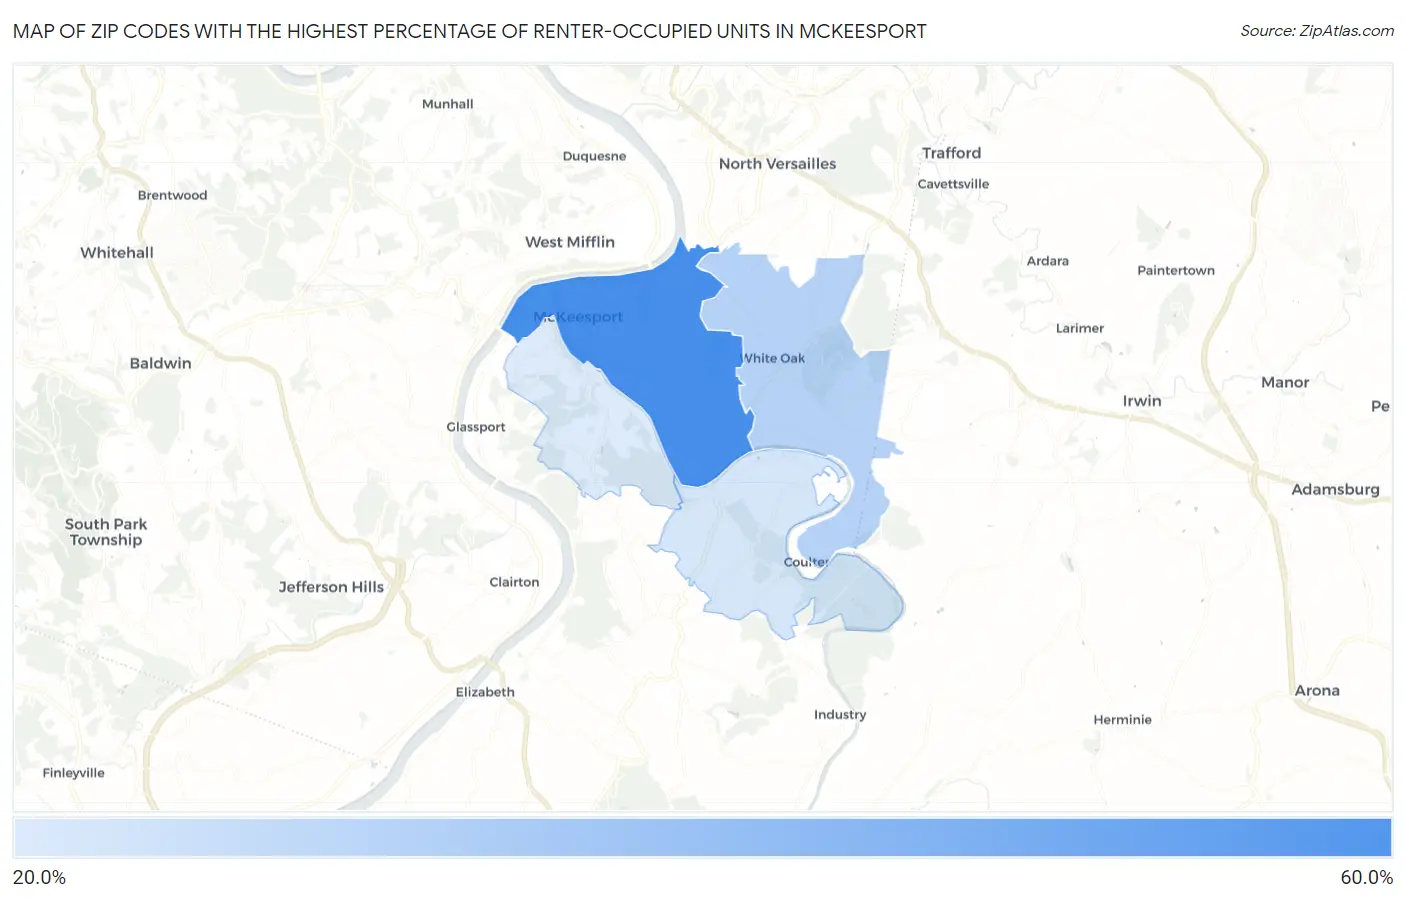
Map of Zip Codes with the Highest Percentage of Renter-Occupied Units in Mckeesport
0.0%
60.0%
Zip Codes with the Highest Percentage of Renter-Occupied Units in Mckeesport, PA
| Zip Code | % Renter-Occupied | vs State | vs National | |
| 1. | 15132 | 50.4% | 30.8%(+19.6)#122 | 35.2%(+15.3)#3,020 |
| 2. | 15131 | 29.0% | 30.8%(-1.84)#463 | 35.2%(-6.21)#10,720 |
| 3. | 15135 | 23.4% | 30.8%(-7.38)#725 | 35.2%(-11.7)#15,035 |
| 4. | 15133 | 22.2% | 30.8%(-8.65)#790 | 35.2%(-13.0)#16,218 |
1
Common Questions
What are the Top 3 Zip Codes with the Highest Percentage of Renter-Occupied Units in Mckeesport, PA?
Top 3 Zip Codes with the Highest Percentage of Renter-Occupied Units in Mckeesport, PA are:
What zip code has the Highest Percentage of Renter-Occupied Units in Mckeesport, PA?
15132 has the Highest Percentage of Renter-Occupied Units in Mckeesport, PA with 50.4%.
What is the Percentage of Renter-Occupied Units in Mckeesport, PA?
Percentage of Renter-Occupied Units in Mckeesport is 50.2%.
What is the Percentage of Renter-Occupied Units in Pennsylvania?
Percentage of Renter-Occupied Units in Pennsylvania is 30.8%.
What is the Percentage of Renter-Occupied Units in the United States?
Percentage of Renter-Occupied Units in the United States is 35.2%.