Zip Codes with the Highest Percentage of Population Employed in Agriculture, Fishing & Hunting in Levittown, PA
RELATED REPORTS & OPTIONS
Agriculture, Fishing & Hunting
Levittown
Compare Zip Codes
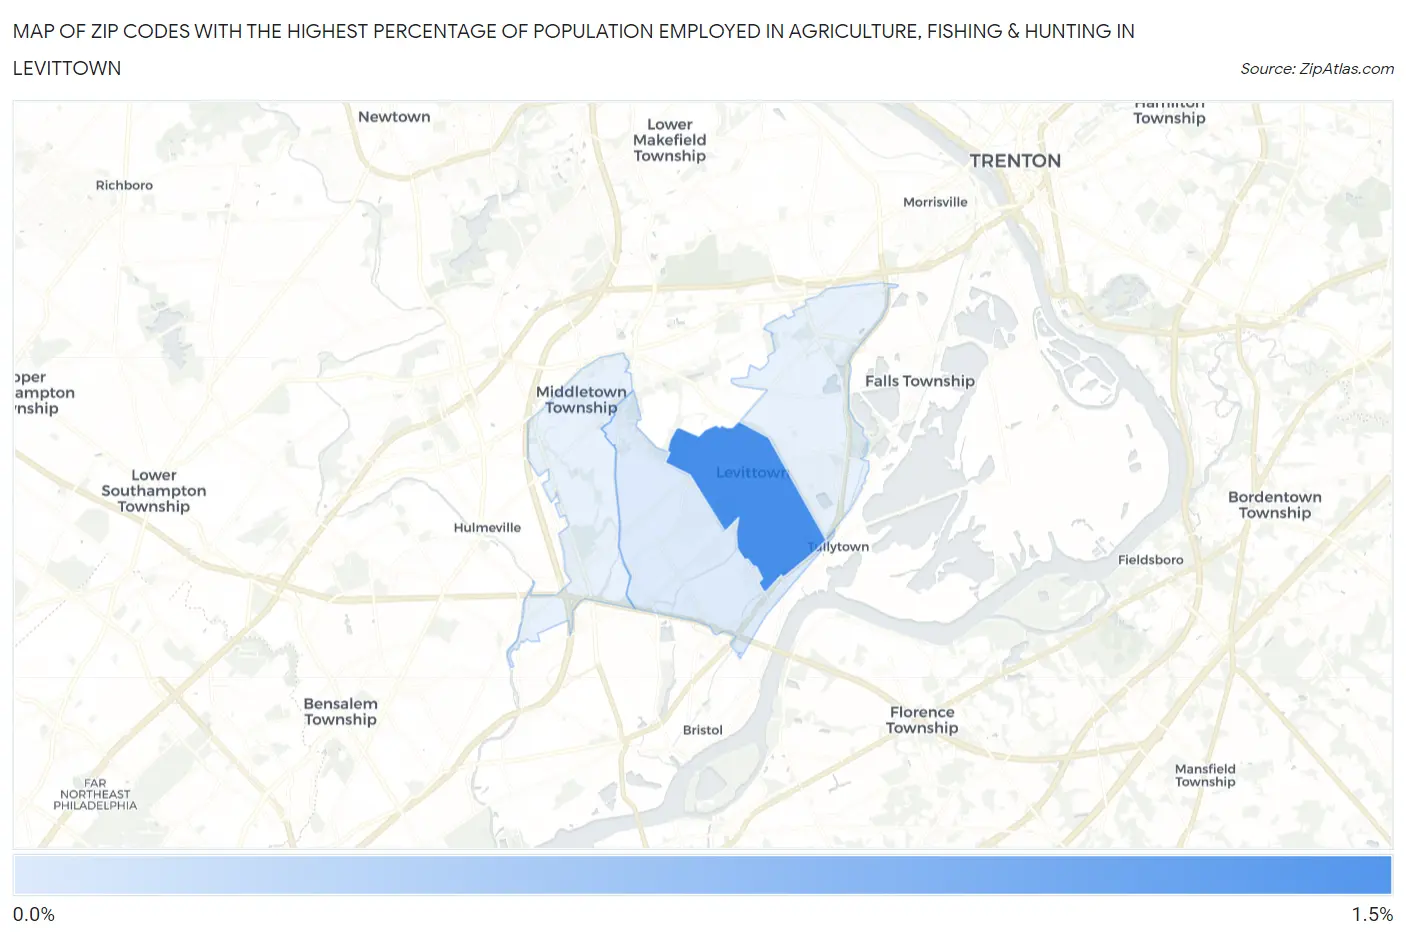
Map of Zip Codes with the Highest Percentage of Population Employed in Agriculture, Fishing & Hunting in Levittown
0.0%
1.5%
Zip Codes with the Highest Percentage of Population Employed in Agriculture, Fishing & Hunting in Levittown, PA
| Zip Code | % Employed | vs State | vs National | |
| 1. | 19055 | 1.1% | 0.87%(+0.274)#576 | 1.2%(-0.059)#15,632 |
| 2. | 19057 | 0.092% | 0.87%(-0.775)#1,037 | 1.2%(-1.11)#23,799 |
1
Common Questions
What are the Top 3 Zip Codes with the Highest Percentage of Population Employed in Agriculture, Fishing & Hunting in Levittown, PA?
Top 3 Zip Codes with the Highest Percentage of Population Employed in Agriculture, Fishing & Hunting in Levittown, PA are:
What zip code has the Highest Percentage of Population Employed in Agriculture, Fishing & Hunting in Levittown, PA?
19055 has the Highest Percentage of Population Employed in Agriculture, Fishing & Hunting in Levittown, PA with 1.1%.
What is the Percentage of Population Employed in Agriculture, Fishing & Hunting in Levittown, PA?
Percentage of Population Employed in Agriculture, Fishing & Hunting in Levittown is 0.30%.
What is the Percentage of Population Employed in Agriculture, Fishing & Hunting in Pennsylvania?
Percentage of Population Employed in Agriculture, Fishing & Hunting in Pennsylvania is 0.87%.
What is the Percentage of Population Employed in Agriculture, Fishing & Hunting in the United States?
Percentage of Population Employed in Agriculture, Fishing & Hunting in the United States is 1.2%.