Zip Codes with the Highest Percentage of Hispanic or Latino Population in Levittown, PA
RELATED REPORTS & OPTIONS
Hispanic or Latino
Levittown
Compare Zip Codes
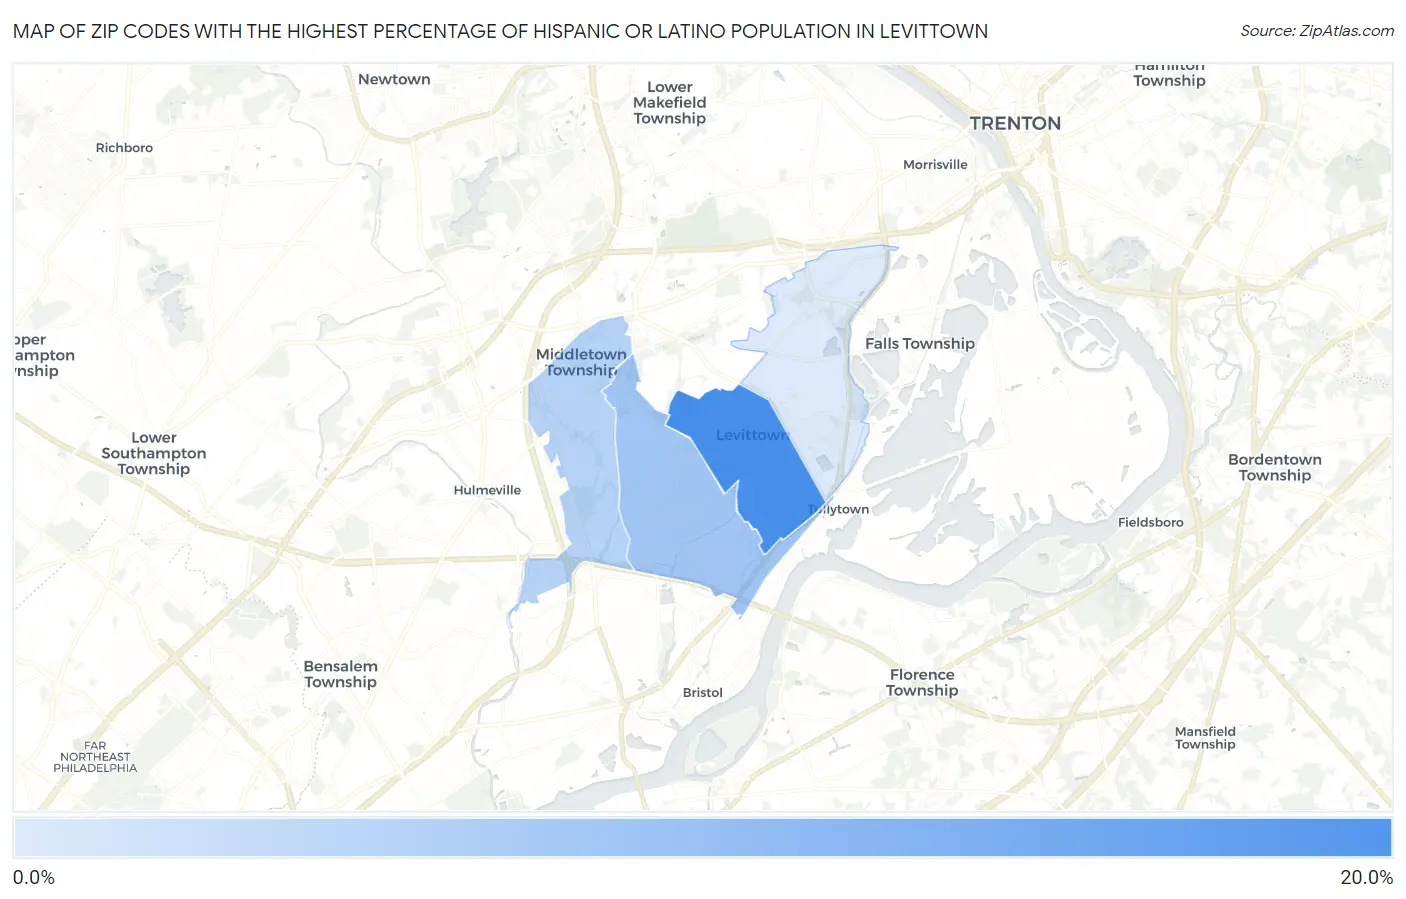
Map of Zip Codes with the Highest Percentage of Hispanic or Latino Population in Levittown
4.8%
15.9%
Zip Codes with the Highest Percentage of Hispanic or Latino Population in Levittown, PA
| Zip Code | Hispanic or Latino | vs State | vs National | |
| 1. | 19055 | 15.9% | 8.1%(+7.80)#97 | 18.7%(-2.73)#5,996 |
| 2. | 19057 | 9.2% | 8.1%(+1.04)#190 | 18.7%(-9.49)#9,573 |
| 3. | 19056 | 7.5% | 8.1%(-0.594)#248 | 18.7%(-11.1)#11,021 |
| 4. | 19054 | 4.8% | 8.1%(-3.35)#392 | 18.7%(-13.9)#14,671 |
1
Common Questions
What are the Top 3 Zip Codes with the Highest Percentage of Hispanic or Latino Population in Levittown, PA?
Top 3 Zip Codes with the Highest Percentage of Hispanic or Latino Population in Levittown, PA are:
What zip code has the Highest Percentage of Hispanic or Latino Population in Levittown, PA?
19055 has the Highest Percentage of Hispanic or Latino Population in Levittown, PA with 15.9%.
What is the Percentage of Hispanic or Latino Population in Levittown, PA?
Percentage of Hispanic or Latino Population in Levittown is 9.8%.
What is the Percentage of Hispanic or Latino Population in Pennsylvania?
Percentage of Hispanic or Latino Population in Pennsylvania is 8.1%.
What is the Percentage of Hispanic or Latino Population in the United States?
Percentage of Hispanic or Latino Population in the United States is 18.7%.