Zip Codes with the Highest Percentage of Population Employed in Arts, Entertainment & Recreation in Lebanon, PA
RELATED REPORTS & OPTIONS
Arts, Entertainment & Recreation
Lebanon
Compare Zip Codes
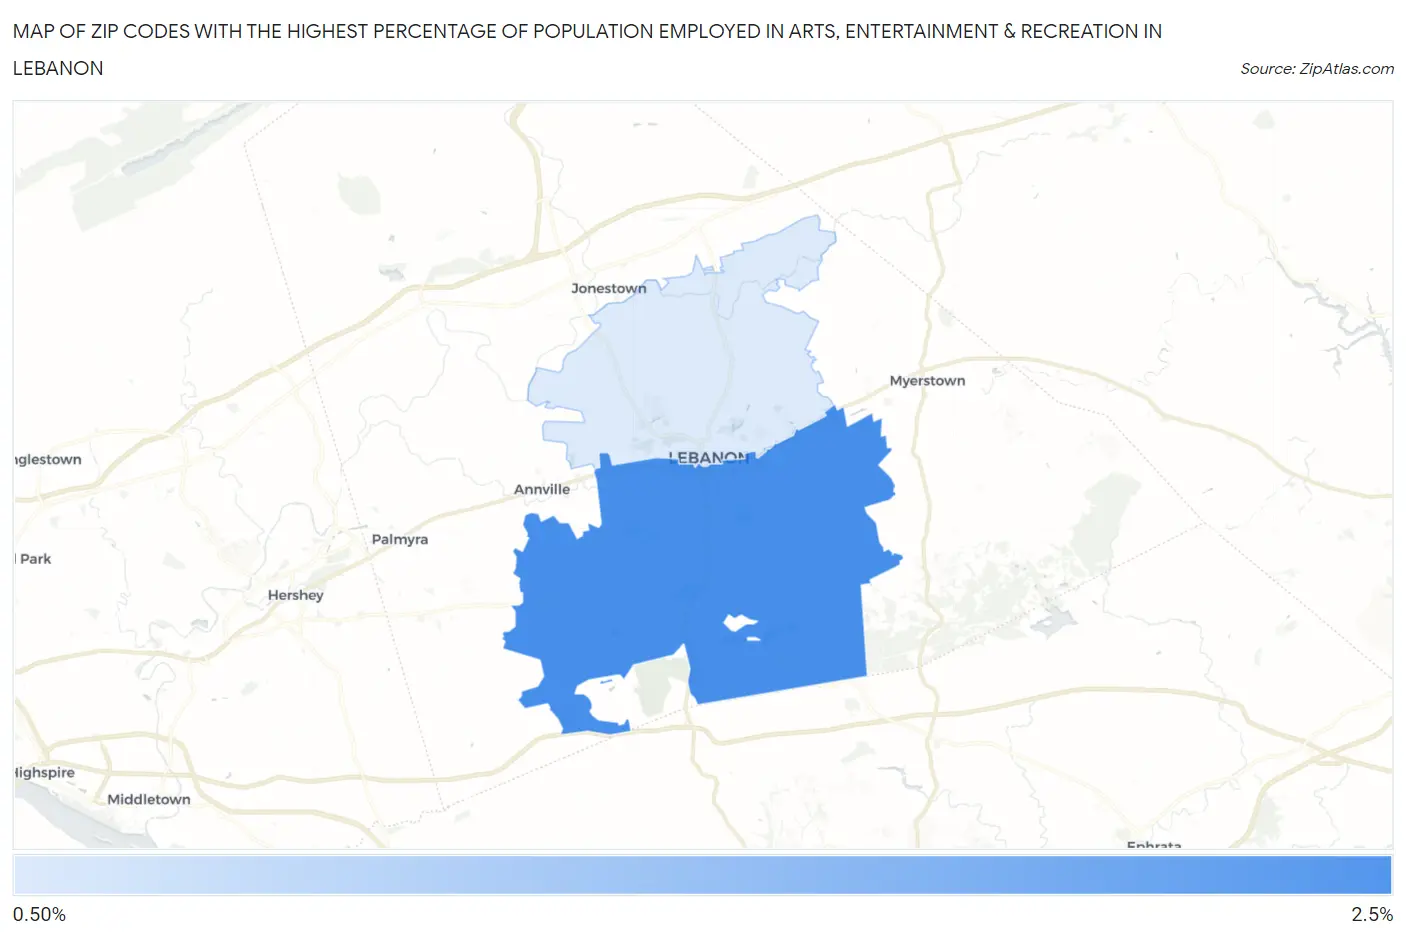
Map of Zip Codes with the Highest Percentage of Population Employed in Arts, Entertainment & Recreation in Lebanon
0.0%
2.5%
Zip Codes with the Highest Percentage of Population Employed in Arts, Entertainment & Recreation in Lebanon, PA
| Zip Code | % Employed | vs State | vs National | |
| 1. | 17042 | 2.4% | 1.8%(+0.562)#325 | 2.1%(+0.278)#7,833 |
| 2. | 17046 | 1.2% | 1.8%(-0.570)#736 | 2.1%(-0.854)#15,269 |
1
Common Questions
What are the Top Zip Codes with the Highest Percentage of Population Employed in Arts, Entertainment & Recreation in Lebanon, PA?
Top Zip Codes with the Highest Percentage of Population Employed in Arts, Entertainment & Recreation in Lebanon, PA are:
What zip code has the Highest Percentage of Population Employed in Arts, Entertainment & Recreation in Lebanon, PA?
17042 has the Highest Percentage of Population Employed in Arts, Entertainment & Recreation in Lebanon, PA with 2.4%.
What is the Percentage of Population Employed in Arts, Entertainment & Recreation in Lebanon, PA?
Percentage of Population Employed in Arts, Entertainment & Recreation in Lebanon is 1.8%.
What is the Percentage of Population Employed in Arts, Entertainment & Recreation in Pennsylvania?
Percentage of Population Employed in Arts, Entertainment & Recreation in Pennsylvania is 1.8%.
What is the Percentage of Population Employed in Arts, Entertainment & Recreation in the United States?
Percentage of Population Employed in Arts, Entertainment & Recreation in the United States is 2.1%.