Zip Codes with the Highest Percentage of Population Employed in Farming, Fishing & Forestry in Lebanon, PA
RELATED REPORTS & OPTIONS
Farming, Fishing & Forestry
Lebanon
Compare Zip Codes
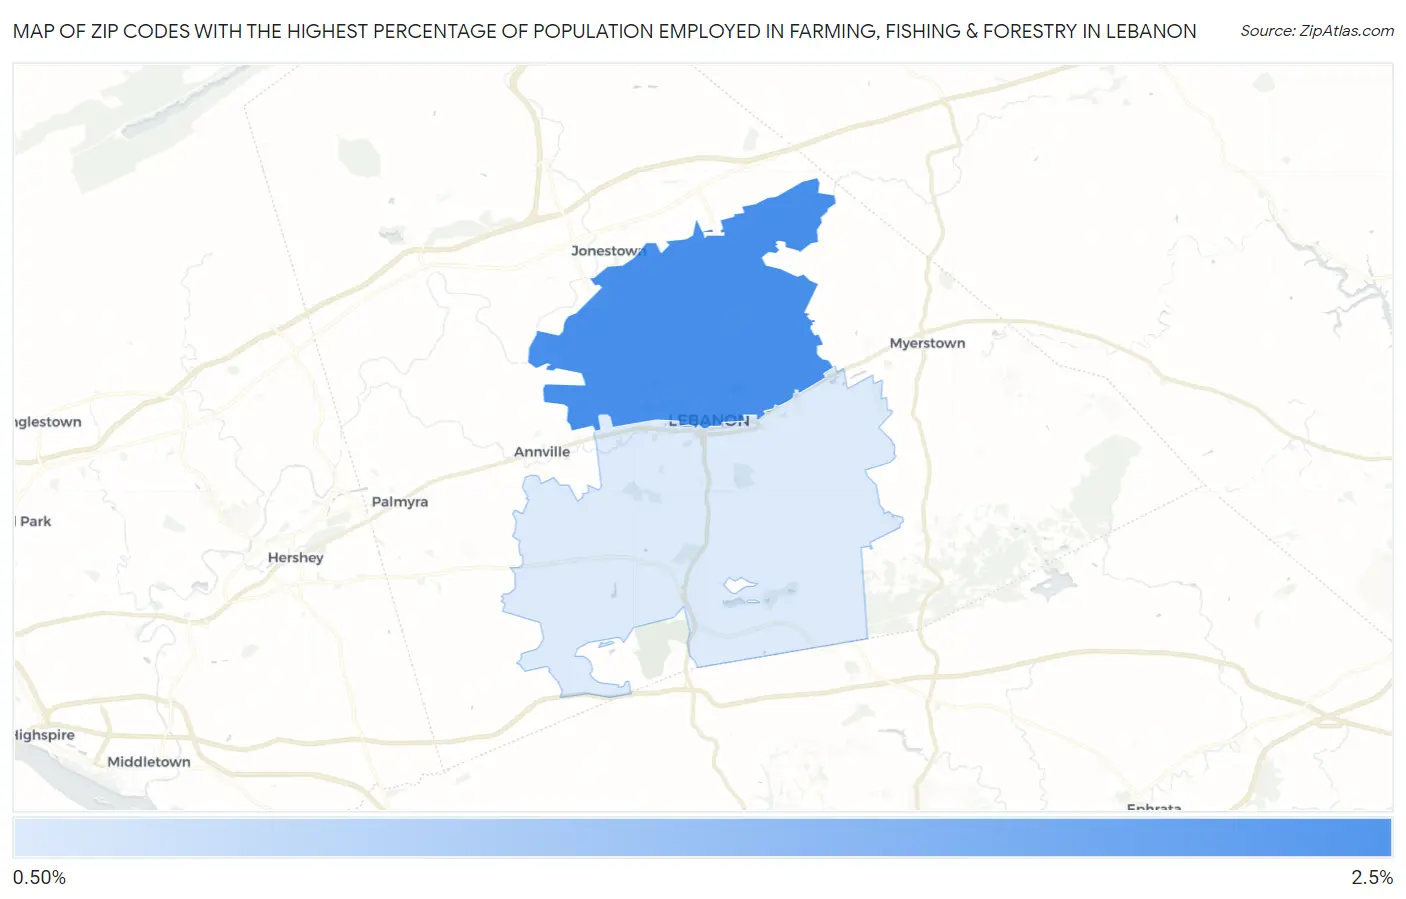
Map of Zip Codes with the Highest Percentage of Population Employed in Farming, Fishing & Forestry in Lebanon
0.0%
2.5%
Zip Codes with the Highest Percentage of Population Employed in Farming, Fishing & Forestry in Lebanon, PA
| Zip Code | % Employed | vs State | vs National | |
| 1. | 17046 | 2.1% | 0.41%(+1.74)#171 | 0.61%(+1.54)#6,242 |
| 2. | 17042 | 0.80% | 0.41%(+0.390)#405 | 0.61%(+0.190)#10,807 |
1
Common Questions
What are the Top Zip Codes with the Highest Percentage of Population Employed in Farming, Fishing & Forestry in Lebanon, PA?
Top Zip Codes with the Highest Percentage of Population Employed in Farming, Fishing & Forestry in Lebanon, PA are:
What zip code has the Highest Percentage of Population Employed in Farming, Fishing & Forestry in Lebanon, PA?
17046 has the Highest Percentage of Population Employed in Farming, Fishing & Forestry in Lebanon, PA with 2.1%.
What is the Percentage of Population Employed in Farming, Fishing & Forestry in Lebanon, PA?
Percentage of Population Employed in Farming, Fishing & Forestry in Lebanon is 0.82%.
What is the Percentage of Population Employed in Farming, Fishing & Forestry in Pennsylvania?
Percentage of Population Employed in Farming, Fishing & Forestry in Pennsylvania is 0.41%.
What is the Percentage of Population Employed in Farming, Fishing & Forestry in the United States?
Percentage of Population Employed in Farming, Fishing & Forestry in the United States is 0.61%.