Zip Codes with the Highest Percentage of Households Heated by Bottled Gas / Liquid Propane in Lancaster, PA
RELATED REPORTS & OPTIONS
Bottled Gas / LP Heating
Lancaster
Compare Zip Codes
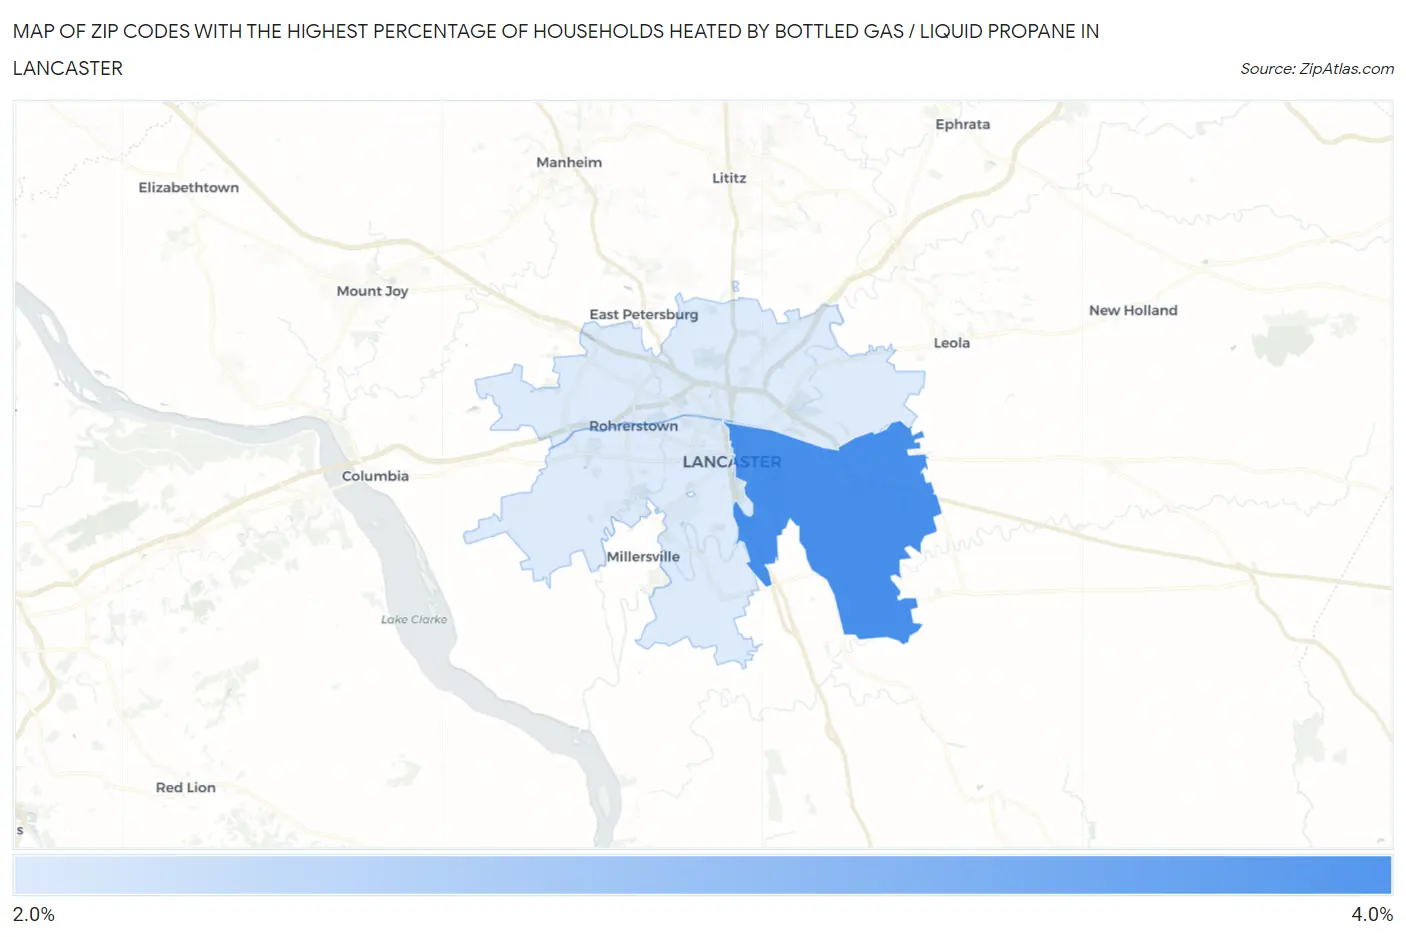
Map of Zip Codes with the Highest Percentage of Households Heated by Bottled Gas / Liquid Propane in Lancaster
0.0%
4.0%
Zip Codes with the Highest Percentage of Households Heated by Bottled Gas / Liquid Propane in Lancaster, PA
| Zip Code | Bottled Gas / LP Heating | vs State | vs National | |
| 1. | 17602 | 3.8% | 4.8%(-1.00)#894 | 4.9%(-1.10)#19,842 |
| 2. | 17603 | 2.5% | 4.8%(-2.30)#1,070 | 4.9%(-2.40)#21,895 |
| 3. | 17601 | 2.5% | 4.8%(-2.30)#1,071 | 4.9%(-2.40)#21,904 |
1
Common Questions
What are the Top 3 Zip Codes with the Highest Percentage of Households Heated by Bottled Gas / Liquid Propane in Lancaster, PA?
Top 3 Zip Codes with the Highest Percentage of Households Heated by Bottled Gas / Liquid Propane in Lancaster, PA are:
What zip code has the Highest Percentage of Households Heated by Bottled Gas / Liquid Propane in Lancaster, PA?
17602 has the Highest Percentage of Households Heated by Bottled Gas / Liquid Propane in Lancaster, PA with 3.8%.
What is the Percentage of Households Heated by Bottled Gas / Liquid Propane in Lancaster, PA?
Percentage of Households Heated by Bottled Gas / Liquid Propane in Lancaster is 1.7%.
What is the Percentage of Households Heated by Bottled Gas / Liquid Propane in Pennsylvania?
Percentage of Households Heated by Bottled Gas / Liquid Propane in Pennsylvania is 4.8%.
What is the Percentage of Households Heated by Bottled Gas / Liquid Propane in the United States?
Percentage of Households Heated by Bottled Gas / Liquid Propane in the United States is 4.9%.