Zip Codes with the Highest Percentage of Households Heated by Bottled Gas / Liquid Propane in Genesee, PA
RELATED REPORTS & OPTIONS
Bottled Gas / LP Heating
Genesee
Compare Zip Codes
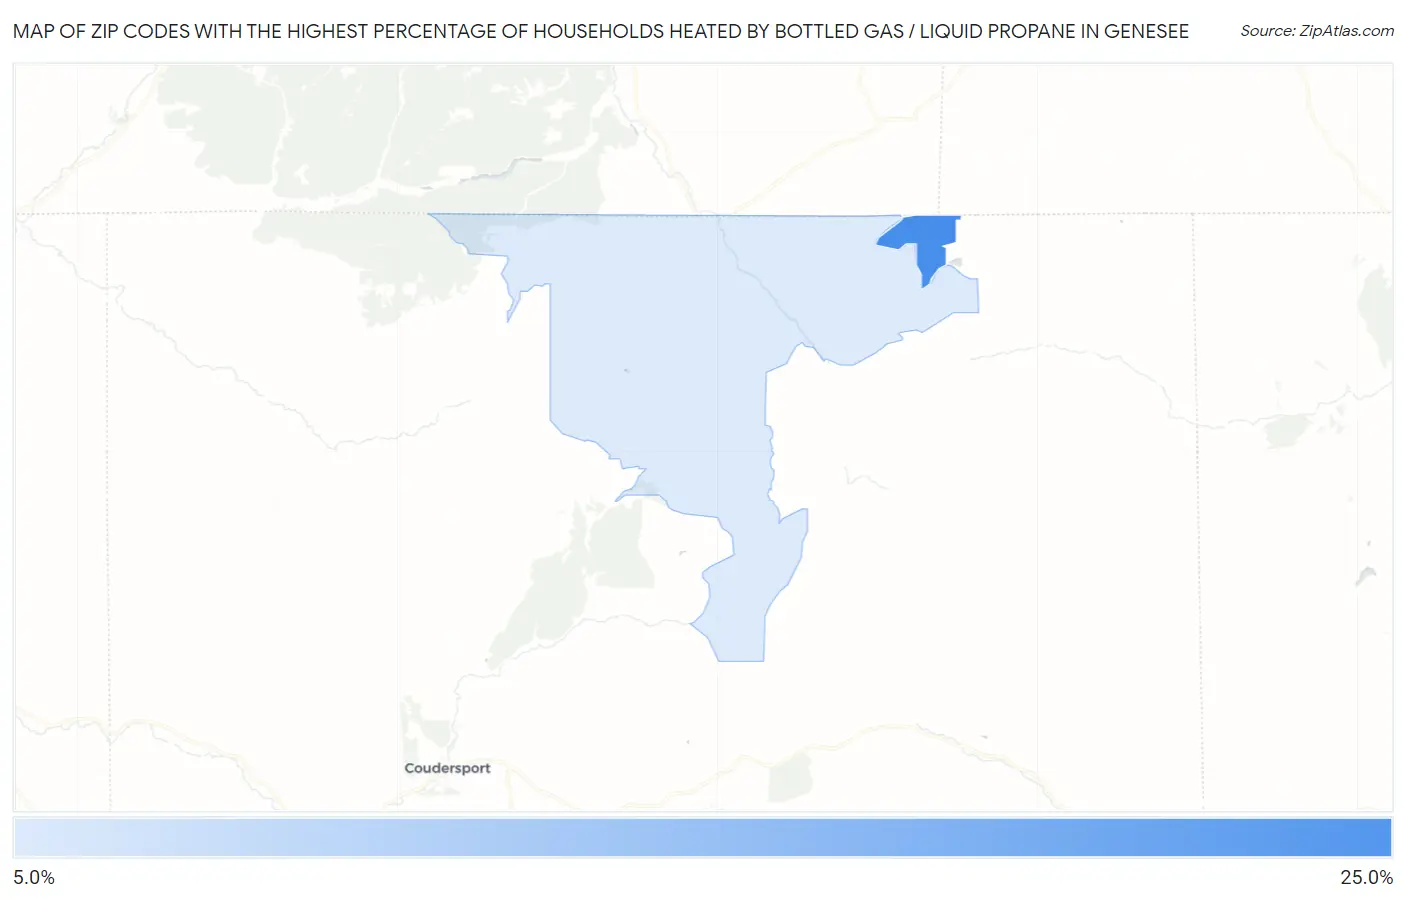
Map of Zip Codes with the Highest Percentage of Households Heated by Bottled Gas / Liquid Propane in Genesee
0.0%
25.0%
Zip Codes with the Highest Percentage of Households Heated by Bottled Gas / Liquid Propane in Genesee, PA
| Zip Code | Bottled Gas / LP Heating | vs State | vs National | |
| 1. | 16941 | 24.0% | 4.8%(+19.2)#96 | 4.9%(+19.1)#7,503 |
| 2. | 16923 | 9.8% | 4.8%(+5.00)#457 | 4.9%(+4.90)#14,631 |
1
Common Questions
What are the Top Zip Codes with the Highest Percentage of Households Heated by Bottled Gas / Liquid Propane in Genesee, PA?
Top Zip Codes with the Highest Percentage of Households Heated by Bottled Gas / Liquid Propane in Genesee, PA are:
What zip code has the Highest Percentage of Households Heated by Bottled Gas / Liquid Propane in Genesee, PA?
16941 has the Highest Percentage of Households Heated by Bottled Gas / Liquid Propane in Genesee, PA with 24.0%.
What is the Percentage of Households Heated by Bottled Gas / Liquid Propane in Pennsylvania?
Percentage of Households Heated by Bottled Gas / Liquid Propane in Pennsylvania is 4.8%.
What is the Percentage of Households Heated by Bottled Gas / Liquid Propane in the United States?
Percentage of Households Heated by Bottled Gas / Liquid Propane in the United States is 4.9%.