Zip Codes with the Highest Percentage of Population Employed in Farming, Fishing & Forestry in Butler, PA
RELATED REPORTS & OPTIONS
Farming, Fishing & Forestry
Butler
Compare Zip Codes
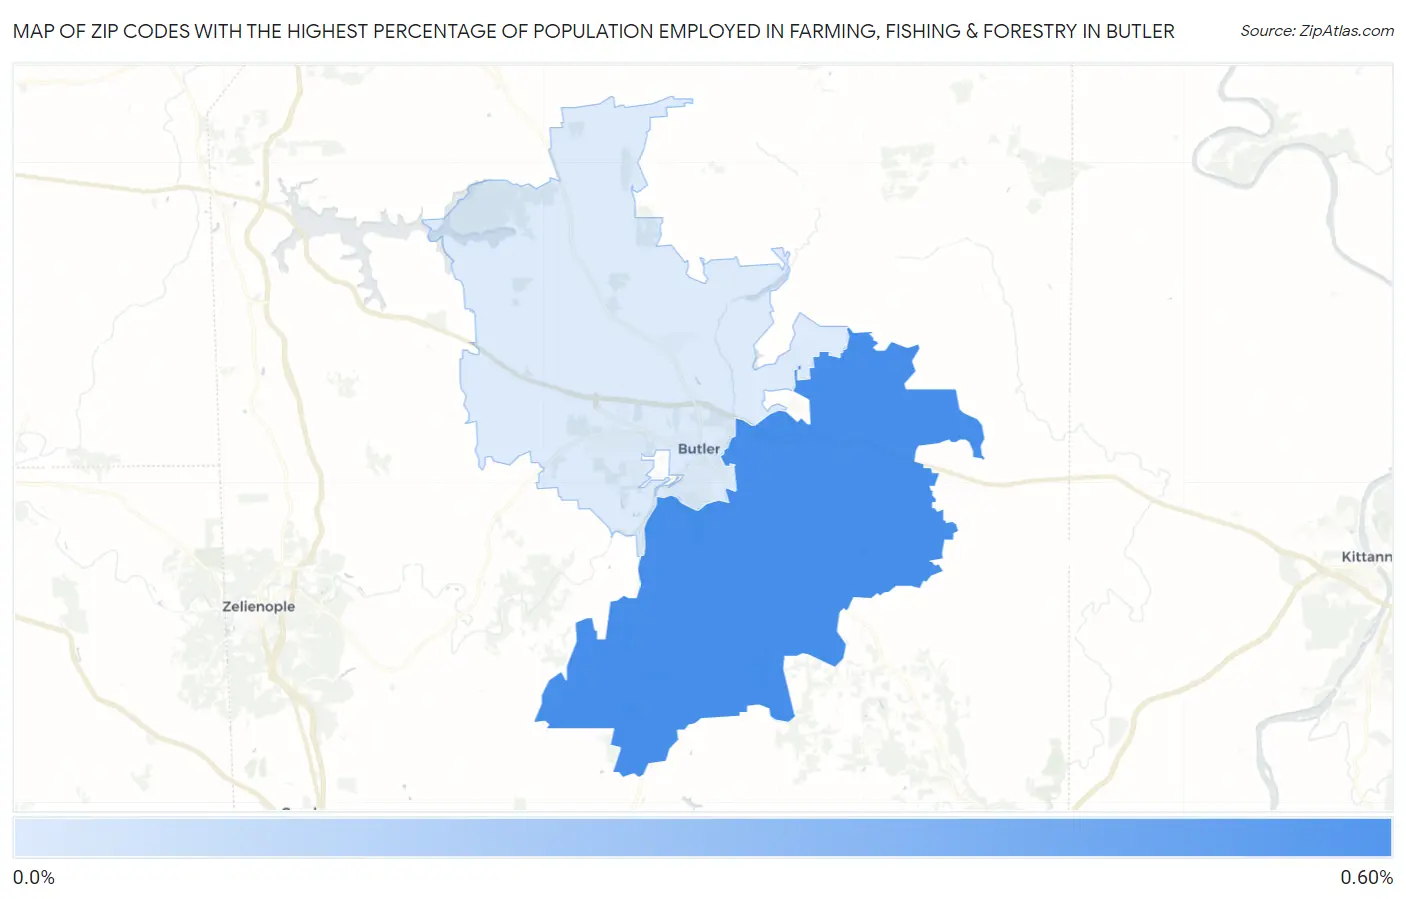
Map of Zip Codes with the Highest Percentage of Population Employed in Farming, Fishing & Forestry in Butler
0.0%
0.60%
Zip Codes with the Highest Percentage of Population Employed in Farming, Fishing & Forestry in Butler, PA
| Zip Code | % Employed | vs State | vs National | |
| 1. | 16002 | 0.56% | 0.41%(+0.159)#483 | 0.61%(-0.041)#12,344 |
| 2. | 16001 | 0.078% | 0.41%(-0.328)#792 | 0.61%(-0.528)#18,160 |
1
Common Questions
What are the Top Zip Codes with the Highest Percentage of Population Employed in Farming, Fishing & Forestry in Butler, PA?
Top Zip Codes with the Highest Percentage of Population Employed in Farming, Fishing & Forestry in Butler, PA are:
What zip code has the Highest Percentage of Population Employed in Farming, Fishing & Forestry in Butler, PA?
16002 has the Highest Percentage of Population Employed in Farming, Fishing & Forestry in Butler, PA with 0.56%.
What is the Percentage of Population Employed in Farming, Fishing & Forestry in Pennsylvania?
Percentage of Population Employed in Farming, Fishing & Forestry in Pennsylvania is 0.41%.
What is the Percentage of Population Employed in Farming, Fishing & Forestry in the United States?
Percentage of Population Employed in Farming, Fishing & Forestry in the United States is 0.61%.