Zip Codes with the Highest Percentage of Self-Employed / Incorporated in Oregon
RELATED REPORTS & OPTIONS
Self-Employed / Incorporated
Oregon
Compare Zip Codes
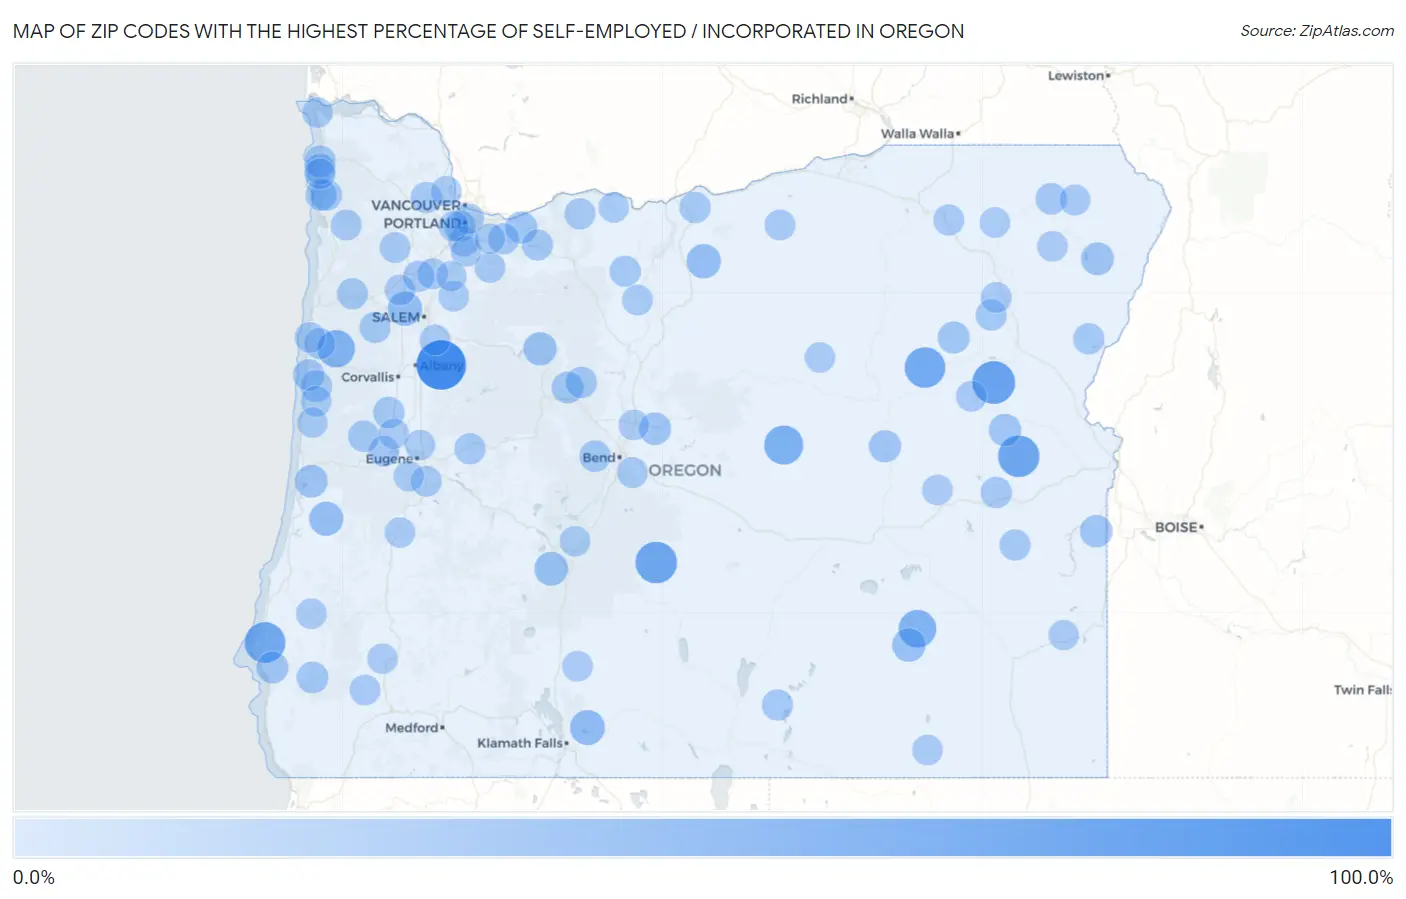
Map of Zip Codes with the Highest Percentage of Self-Employed / Incorporated in Oregon
0.0%
100.0%
Zip Codes with the Highest Percentage of Self-Employed / Incorporated in Oregon
| Zip Code | % Self-Employed / Incorporated | vs State | vs National | |
| 1. | 97335 | 100.0% | 4.2%(+95.8)#1 | 3.8%(+96.2)#1 |
| 2. | 97837 | 66.7% | 4.2%(+62.5)#2 | 3.8%(+62.8)#43 |
| 3. | 97735 | 60.9% | 4.2%(+56.7)#3 | 3.8%(+57.1)#52 |
| 4. | 97920 | 60.0% | 4.2%(+55.8)#4 | 3.8%(+56.2)#54 |
| 5. | 97476 | 57.0% | 4.2%(+52.8)#5 | 3.8%(+53.1)#62 |
| 6. | 97817 | 55.6% | 4.2%(+51.4)#6 | 3.8%(+51.7)#69 |
| 7. | 97751 | 48.4% | 4.2%(+44.2)#7 | 3.8%(+44.6)#93 |
| 8. | 97722 | 41.4% | 4.2%(+37.2)#8 | 3.8%(+37.6)#123 |
| 9. | 97357 | 40.0% | 4.2%(+35.8)#9 | 3.8%(+36.2)#131 |
| 10. | 97625 | 28.3% | 4.2%(+24.1)#10 | 3.8%(+24.4)#248 |
| 11. | 97371 | 26.1% | 4.2%(+21.9)#11 | 3.8%(+22.3)#286 |
| 12. | 97033 | 25.0% | 4.2%(+20.8)#12 | 3.8%(+21.2)#313 |
| 13. | 97473 | 24.5% | 4.2%(+20.3)#13 | 3.8%(+20.7)#324 |
| 14. | 97733 | 22.2% | 4.2%(+18.0)#14 | 3.8%(+18.4)#401 |
| 15. | 97721 | 20.8% | 4.2%(+16.6)#15 | 3.8%(+17.0)#460 |
| 16. | 97342 | 20.0% | 4.2%(+15.8)#16 | 3.8%(+16.2)#513 |
| 17. | 97846 | 18.4% | 4.2%(+14.2)#17 | 3.8%(+14.6)#592 |
| 18. | 97493 | 17.7% | 4.2%(+13.6)#18 | 3.8%(+13.9)#643 |
| 19. | 97901 | 16.6% | 4.2%(+12.4)#19 | 3.8%(+12.8)#747 |
| 20. | 97753 | 16.2% | 4.2%(+12.0)#20 | 3.8%(+12.4)#794 |
| 21. | 97908 | 15.4% | 4.2%(+11.2)#21 | 3.8%(+11.6)#901 |
| 22. | 97873 | 15.3% | 4.2%(+11.1)#22 | 3.8%(+11.5)#908 |
| 23. | 97019 | 14.6% | 4.2%(+10.4)#23 | 3.8%(+10.8)#1,030 |
| 24. | 97877 | 13.8% | 4.2%(+9.61)#24 | 3.8%(+9.98)#1,177 |
| 25. | 97465 | 13.3% | 4.2%(+9.14)#25 | 3.8%(+9.51)#1,260 |
| 26. | 97759 | 13.2% | 4.2%(+9.02)#26 | 3.8%(+9.38)#1,280 |
| 27. | 97406 | 13.0% | 4.2%(+8.82)#27 | 3.8%(+9.19)#1,321 |
| 28. | 97376 | 12.5% | 4.2%(+8.34)#28 | 3.8%(+8.71)#1,432 |
| 29. | 97366 | 12.0% | 4.2%(+7.77)#29 | 3.8%(+8.13)#1,575 |
| 30. | 97885 | 11.8% | 4.2%(+7.66)#30 | 3.8%(+8.03)#1,596 |
| 31. | 97110 | 11.8% | 4.2%(+7.60)#31 | 3.8%(+7.97)#1,616 |
| 32. | 97412 | 11.7% | 4.2%(+7.52)#32 | 3.8%(+7.88)#1,655 |
| 33. | 97703 | 11.7% | 4.2%(+7.52)#33 | 3.8%(+7.88)#1,656 |
| 34. | 97730 | 11.7% | 4.2%(+7.50)#34 | 3.8%(+7.87)#1,660 |
| 35. | 97147 | 11.5% | 4.2%(+7.28)#35 | 3.8%(+7.65)#1,733 |
| 36. | 97130 | 11.4% | 4.2%(+7.26)#36 | 3.8%(+7.63)#1,740 |
| 37. | 97456 | 11.2% | 4.2%(+7.01)#37 | 3.8%(+7.38)#1,809 |
| 38. | 97065 | 10.9% | 4.2%(+6.69)#38 | 3.8%(+7.05)#1,947 |
| 39. | 97911 | 10.7% | 4.2%(+6.53)#39 | 3.8%(+6.90)#2,011 |
| 40. | 97870 | 10.7% | 4.2%(+6.51)#40 | 3.8%(+6.88)#2,020 |
| 41. | 97489 | 10.4% | 4.2%(+6.20)#41 | 3.8%(+6.57)#2,141 |
| 42. | 97133 | 10.3% | 4.2%(+6.12)#42 | 3.8%(+6.49)#2,171 |
| 43. | 97637 | 10.1% | 4.2%(+5.96)#43 | 3.8%(+6.33)#2,243 |
| 44. | 97833 | 10.0% | 4.2%(+5.86)#44 | 3.8%(+6.22)#2,296 |
| 45. | 97906 | 10.0% | 4.2%(+5.82)#45 | 3.8%(+6.18)#2,314 |
| 46. | 97009 | 10.0% | 4.2%(+5.80)#46 | 3.8%(+6.17)#2,331 |
| 47. | 97114 | 9.9% | 4.2%(+5.76)#47 | 3.8%(+6.12)#2,359 |
| 48. | 97031 | 9.9% | 4.2%(+5.70)#48 | 3.8%(+6.07)#2,378 |
| 49. | 97063 | 9.8% | 4.2%(+5.58)#49 | 3.8%(+5.95)#2,434 |
| 50. | 97380 | 9.7% | 4.2%(+5.49)#50 | 3.8%(+5.86)#2,482 |
| 51. | 97011 | 9.6% | 4.2%(+5.45)#51 | 3.8%(+5.82)#2,498 |
| 52. | 97347 | 9.5% | 4.2%(+5.34)#52 | 3.8%(+5.71)#2,573 |
| 53. | 97344 | 9.5% | 4.2%(+5.32)#53 | 3.8%(+5.69)#2,586 |
| 54. | 97221 | 9.5% | 4.2%(+5.30)#54 | 3.8%(+5.67)#2,596 |
| 55. | 97828 | 8.9% | 4.2%(+4.69)#55 | 3.8%(+5.06)#2,959 |
| 56. | 97437 | 8.8% | 4.2%(+4.59)#56 | 3.8%(+4.96)#3,028 |
| 57. | 97859 | 8.8% | 4.2%(+4.59)#57 | 3.8%(+4.95)#3,030 |
| 58. | 97702 | 8.8% | 4.2%(+4.58)#58 | 3.8%(+4.94)#3,038 |
| 59. | 97392 | 8.7% | 4.2%(+4.53)#59 | 3.8%(+4.90)#3,068 |
| 60. | 97426 | 8.7% | 4.2%(+4.50)#60 | 3.8%(+4.86)#3,091 |
| 61. | 97843 | 8.4% | 4.2%(+4.23)#61 | 3.8%(+4.60)#3,302 |
| 62. | 97137 | 8.4% | 4.2%(+4.22)#62 | 3.8%(+4.59)#3,311 |
| 63. | 97141 | 8.3% | 4.2%(+4.13)#63 | 3.8%(+4.50)#3,383 |
| 64. | 97037 | 8.3% | 4.2%(+4.07)#64 | 3.8%(+4.44)#3,434 |
| 65. | 97145 | 8.1% | 4.2%(+3.96)#65 | 3.8%(+4.32)#3,532 |
| 66. | 97102 | 8.1% | 4.2%(+3.91)#66 | 3.8%(+4.28)#3,582 |
| 67. | 97148 | 8.0% | 4.2%(+3.86)#67 | 3.8%(+4.23)#3,630 |
| 68. | 97101 | 8.0% | 4.2%(+3.86)#68 | 3.8%(+4.22)#3,633 |
| 69. | 97884 | 8.0% | 4.2%(+3.82)#69 | 3.8%(+4.18)#3,667 |
| 70. | 97867 | 7.9% | 4.2%(+3.72)#70 | 3.8%(+4.09)#3,757 |
| 71. | 97532 | 7.8% | 4.2%(+3.62)#71 | 3.8%(+3.98)#3,865 |
| 72. | 97034 | 7.8% | 4.2%(+3.60)#72 | 3.8%(+3.97)#3,878 |
| 73. | 97362 | 7.6% | 4.2%(+3.46)#73 | 3.8%(+3.83)#4,023 |
| 74. | 97394 | 7.6% | 4.2%(+3.42)#74 | 3.8%(+3.79)#4,061 |
| 75. | 97212 | 7.6% | 4.2%(+3.41)#75 | 3.8%(+3.78)#4,075 |
| 76. | 97004 | 7.6% | 4.2%(+3.41)#76 | 3.8%(+3.78)#4,076 |
| 77. | 97458 | 7.5% | 4.2%(+3.35)#77 | 3.8%(+3.72)#4,129 |
| 78. | 97499 | 7.4% | 4.2%(+3.24)#78 | 3.8%(+3.61)#4,238 |
| 79. | 97341 | 7.4% | 4.2%(+3.24)#79 | 3.8%(+3.61)#4,245 |
| 80. | 97442 | 7.4% | 4.2%(+3.17)#80 | 3.8%(+3.54)#4,326 |
| 81. | 97737 | 7.3% | 4.2%(+3.16)#81 | 3.8%(+3.52)#4,350 |
| 82. | 97756 | 7.3% | 4.2%(+3.12)#82 | 3.8%(+3.49)#4,393 |
| 83. | 97624 | 7.3% | 4.2%(+3.08)#83 | 3.8%(+3.45)#4,440 |
| 84. | 97068 | 7.2% | 4.2%(+3.02)#84 | 3.8%(+3.39)#4,501 |
| 85. | 97857 | 7.2% | 4.2%(+2.99)#85 | 3.8%(+3.36)#4,544 |
| 86. | 97710 | 7.1% | 4.2%(+2.96)#86 | 3.8%(+3.33)#4,586 |
| 87. | 97231 | 7.0% | 4.2%(+2.84)#87 | 3.8%(+3.21)#4,739 |
| 88. | 97876 | 7.0% | 4.2%(+2.82)#88 | 3.8%(+3.18)#4,766 |
| 89. | 97904 | 6.9% | 4.2%(+2.75)#89 | 3.8%(+3.11)#4,854 |
| 90. | 97405 | 6.9% | 4.2%(+2.71)#90 | 3.8%(+3.08)#4,895 |
| 91. | 97848 | 6.9% | 4.2%(+2.68)#91 | 3.8%(+3.05)#4,949 |
| 92. | 97032 | 6.8% | 4.2%(+2.63)#92 | 3.8%(+3.00)#5,008 |
| 93. | 97498 | 6.8% | 4.2%(+2.62)#93 | 3.8%(+2.98)#5,031 |
| 94. | 97448 | 6.8% | 4.2%(+2.60)#94 | 3.8%(+2.97)#5,048 |
| 95. | 97121 | 6.7% | 4.2%(+2.56)#95 | 3.8%(+2.92)#5,122 |
| 96. | 97089 | 6.7% | 4.2%(+2.54)#96 | 3.8%(+2.91)#5,148 |
| 97. | 97910 | 6.7% | 4.2%(+2.54)#97 | 3.8%(+2.90)#5,152 |
| 98. | 97040 | 6.7% | 4.2%(+2.53)#98 | 3.8%(+2.90)#5,159 |
| 99. | 97225 | 6.6% | 4.2%(+2.45)#99 | 3.8%(+2.82)#5,300 |
| 100. | 97408 | 6.6% | 4.2%(+2.44)#100 | 3.8%(+2.80)#5,319 |
Common Questions
What are the Top 10 Zip Codes with the Highest Percentage of Self-Employed / Incorporated in Oregon?
Top 10 Zip Codes with the Highest Percentage of Self-Employed / Incorporated in Oregon are:
What zip code has the Highest Percentage of Self-Employed / Incorporated in Oregon?
97335 has the Highest Percentage of Self-Employed / Incorporated in Oregon with 100.0%.
What is the Percentage of Self-Employed / Incorporated in the State of Oregon?
Percentage of Self-Employed / Incorporated in Oregon is 4.2%.
What is the Percentage of Self-Employed / Incorporated in the United States?
Percentage of Self-Employed / Incorporated in the United States is 3.8%.