Zip Codes with the Highest Percentage of Self-Employed / Incorporated in Portland, OR

RELATED REPORTS & OPTIONS

Self-Employed / Incorporated
Population
Families and Households
Female Fertility
Female Fertility (Unmarried)
Race (Community Size)
Race (Percentage)
Ancestry (Community Size)
AfghanAfricanAlaska NativeAlaskan AthabascanAlbanianAleutAlsatianAmericanApacheArabArgentineanArmenianAustralianAustrianBahamianBangladeshiBasqueBelgianBelizeanBhutaneseBlackfeetBolivianBrazilianBritishBritish West IndianBulgarianBurmeseCajunCambodianCanadianCelticCentral AmericanCentral American IndianCherokeeCheyenneChickasawChileanChineseChippewaChoctawColombianColvilleCosta RicanCreeCreekCroatianCubanCzechCzechoslovakianDanishDelawareDominicanDutchEastern EuropeanEcuadorianEgyptianEnglishEstonianEthiopianEuropeanFijianFilipinoFinnishFrenchFrench American IndianFrench CanadianGermanGerman RussianGhanaianGreekGuamanian / ChamorroGuatemalanGuyaneseHaitianHonduranHopiHungarianIcelanderIndian (Asian)IndonesianInupiatIranianIraqiIrishIroquoisIsraeliItalianJamaicanJapaneseJordanianKenyanKoreanLaotianLatvianLebaneseLiberianLithuanianLumbeeLuxembourgerMacedonianMalaysianMalteseMarshalleseMexicanMexican American IndianMongolianMoroccanNative HawaiianNavajoNepaleseNew ZealanderNicaraguanNigerianNorthern EuropeanNorwegianOkinawanOsagePaiutePakistaniPalestinianPanamanianParaguayanPennsylvania GermanPeruvianPimaPolishPortuguesePotawatomiPuebloPuerto RicanPuget Sound SalishRomanianRussianSalvadoranSamoanScandinavianScotch-IrishScottishSeminoleSenegaleseSerbianShoshoneSierra LeoneanSiouxSlavicSlovakSloveneSomaliSouth AfricanSouth AmericanSouth American IndianSoviet UnionSpaniardSpanishSpanish AmericanSpanish American IndianSri LankanSubsaharan AfricanSwedishSwissSyrianThaiTlingit-HaidaTonganTrinidadian and TobagonianTsimshianTurkishUgandanUkrainianUruguayanUteVenezuelanVietnameseWelshWest IndianYakamaYaquiYugoslavianYup'ik
Ancestry (Percentage)
AfghanAfricanAlaska NativeAlaskan AthabascanAlbanianAleutAlsatianAmericanApacheArabArgentineanArmenianAustralianAustrianBahamianBangladeshiBasqueBelgianBelizeanBhutaneseBlackfeetBolivianBrazilianBritishBritish West IndianBulgarianBurmeseCajunCambodianCanadianCelticCentral AmericanCentral American IndianCherokeeCheyenneChickasawChileanChineseChippewaChoctawColombianColvilleCosta RicanCreeCreekCroatianCubanCzechCzechoslovakianDanishDelawareDominicanDutchEastern EuropeanEcuadorianEgyptianEnglishEstonianEthiopianEuropeanFijianFilipinoFinnishFrenchFrench American IndianFrench CanadianGermanGerman RussianGhanaianGreekGuamanian / ChamorroGuatemalanGuyaneseHaitianHonduranHopiHungarianIcelanderIndian (Asian)IndonesianInupiatIranianIraqiIrishIroquoisIsraeliItalianJamaicanJapaneseJordanianKenyanKoreanLaotianLatvianLebaneseLiberianLithuanianLumbeeLuxembourgerMacedonianMalaysianMalteseMarshalleseMexicanMexican American IndianMongolianMoroccanNative HawaiianNavajoNepaleseNew ZealanderNicaraguanNigerianNorthern EuropeanNorwegianOkinawanOsagePaiutePakistaniPalestinianPanamanianParaguayanPennsylvania GermanPeruvianPimaPolishPortuguesePotawatomiPuebloPuerto RicanPuget Sound SalishRomanianRussianSalvadoranSamoanScandinavianScotch-IrishScottishSeminoleSenegaleseSerbianShoshoneSierra LeoneanSiouxSlavicSlovakSloveneSomaliSouth AfricanSouth AmericanSouth American IndianSoviet UnionSpaniardSpanishSpanish AmericanSpanish American IndianSri LankanSubsaharan AfricanSwedishSwissSyrianThaiTlingit-HaidaTonganTrinidadian and TobagonianTsimshianTurkishUgandanUkrainianUruguayanUteVenezuelanVietnameseWelshWest IndianYakamaYaquiYugoslavianYup'ik
Immigrant Origin (Total)
AfghanistanAfricaArgentinaArmeniaAsiaAustraliaAustriaBahamasBangladeshBarbadosBelarusBelgiumBelizeBosnia and HerzegovinaBrazilBulgariaBurma / MyanmarCambodiaCameroonCanadaCaribbeanCentral AmericaChileChinaColombiaCongoCosta RicaCroatiaCubaCzechoslovakiaDenmarkDominican RepublicEastern AfricaEastern AsiaEastern EuropeEcuadorEgyptEl SalvadorEnglandEritreaEthiopiaEuropeFijiFranceGermanyGhanaGreeceGuatemalaHaitiHondurasHong KongHungaryIndiaIndonesiaIranIraqIrelandIsraelItalyJamaicaJapanJordanKazakhstanKenyaKoreaKuwaitLaosLatin AmericaLatviaLebanonLiberiaLithuaniaMalaysiaMexicoMicronesiaMiddle AfricaMoldovaMoroccoNepalNetherlandsNicaraguaNigeriaNorth MacedoniaNorthern AfricaNorthern EuropeNorwayOceaniaPakistanPanamaPeruPhilippinesPolandPortugalRomaniaRussiaSaudi ArabiaScotlandSerbiaSingaporeSomaliaSouth AfricaSouth AmericaSouth Central AsiaSouth Eastern AsiaSouthern EuropeSpainSri LankaSudanSwedenSwitzerlandSyriaTaiwanThailandTrinidad and TobagoTurkeyUgandaUkraineUruguayUzbekistanVenezuelaVietnamWestern AfricaWestern AsiaWestern EuropeYemen
Immigrant Origin (Percentage)
AfghanistanAfricaArgentinaArmeniaAsiaAustraliaAustriaBahamasBangladeshBarbadosBelarusBelgiumBelizeBosnia and HerzegovinaBrazilBulgariaBurma / MyanmarCambodiaCameroonCanadaCaribbeanCentral AmericaChileChinaColombiaCongoCosta RicaCroatiaCubaCzechoslovakiaDenmarkDominican RepublicEastern AfricaEastern AsiaEastern EuropeEcuadorEgyptEl SalvadorEnglandEritreaEthiopiaEuropeFijiFranceGermanyGhanaGreeceGuatemalaHaitiHondurasHong KongHungaryIndiaIndonesiaIranIraqIrelandIsraelItalyJamaicaJapanJordanKazakhstanKenyaKoreaKuwaitLaosLatin AmericaLatviaLebanonLiberiaLithuaniaMalaysiaMexicoMicronesiaMiddle AfricaMoldovaMoroccoNepalNetherlandsNicaraguaNigeriaNorth MacedoniaNorthern AfricaNorthern EuropeNorwayOceaniaPakistanPanamaPeruPhilippinesPolandPortugalRomaniaRussiaSaudi ArabiaScotlandSerbiaSingaporeSomaliaSouth AfricaSouth AmericaSouth Central AsiaSouth Eastern AsiaSouthern EuropeSpainSri LankaSudanSwedenSwitzerlandSyriaTaiwanThailandTrinidad and TobagoTurkeyUgandaUkraineUruguayUzbekistanVenezuelaVietnamWestern AfricaWestern AsiaWestern EuropeYemen
Income
Income (Families)
Income (Households)
Poverty
Poverty (Families)
Unemployment
Employment Occupations
Employment Industries
Employer Class
Commute Time
Commute Means
School Enrollment
Education by Degree Field
Occupancy
Finances
Physical Characteristics
Portland
Compare Zip Codes
Comparison Subject

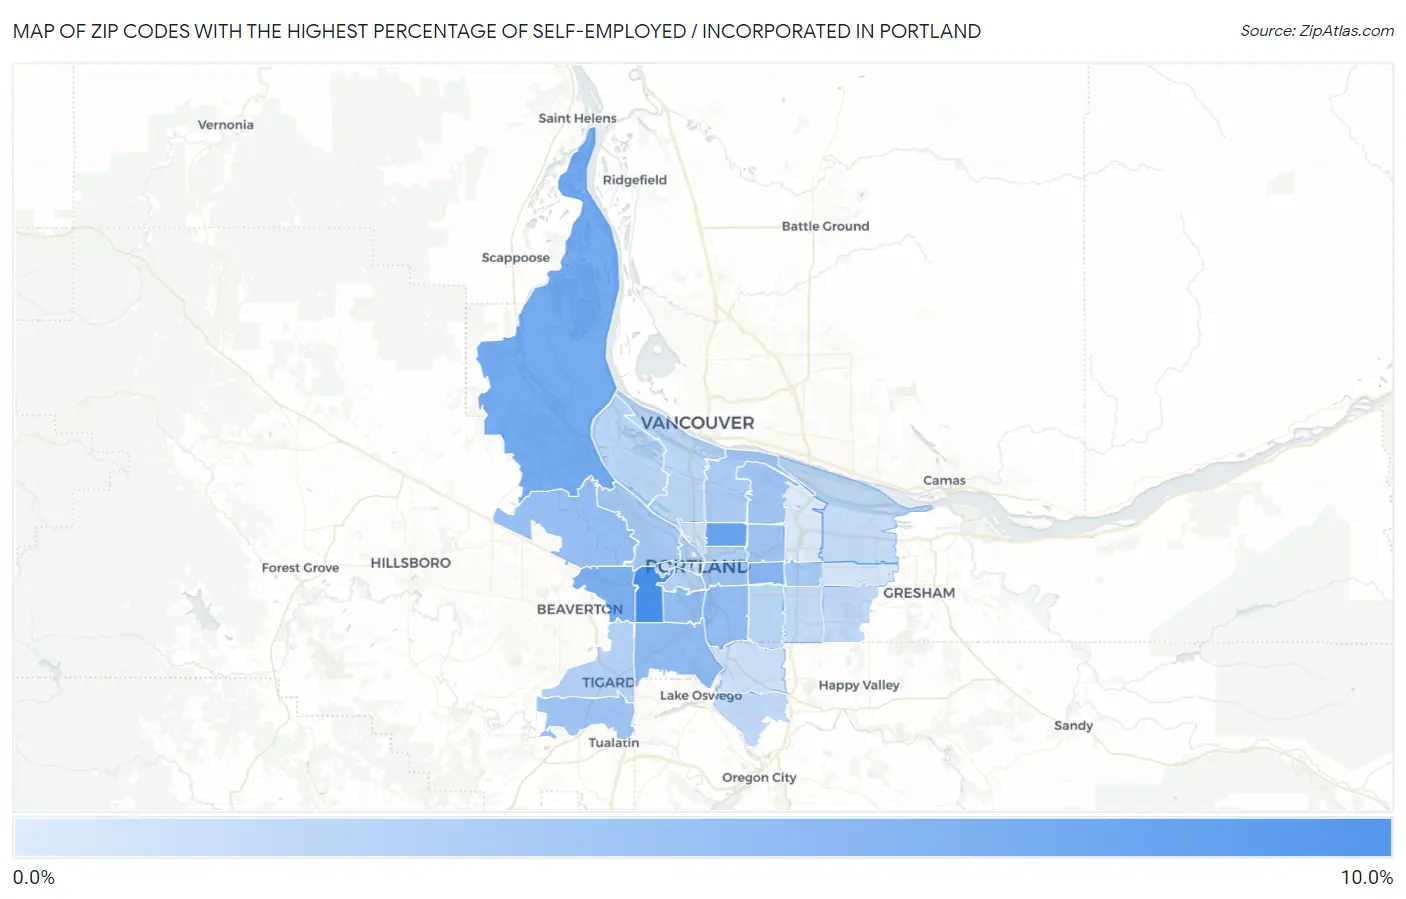
Map of Zip Codes with the Highest Percentage of Self-Employed / Incorporated in Portland

0.0%
10.0%
Zip Codes with the Highest Percentage of Self-Employed / Incorporated in Portland Map

Zip Codes with the Highest Percentage of Self-Employed / Incorporated in Portland, OR

Zip Code % Self-Employed / Incorporated vs State vs National
1.972219.5%4.2%(+5.30)#543.8%(+5.67)#2,596
2.972127.6%4.2%(+3.41)#753.8%(+3.78)#4,075
3.972317.0%4.2%(+2.84)#873.8%(+3.21)#4,739
4.972256.6%4.2%(+2.45)#993.8%(+2.82)#5,300
5.972156.2%4.2%(+2.03)#1073.8%(+2.40)#5,950
6.972195.6%4.2%(+1.46)#1243.8%(+1.83)#7,004
7.972025.5%4.2%(+1.32)#1303.8%(+1.68)#7,352
8.972395.5%4.2%(+1.27)#1333.8%(+1.64)#7,455
9.972295.2%4.2%(+1.06)#1403.8%(+1.43)#7,960
10.972145.1%4.2%(+0.955)#1443.8%(+1.32)#8,232
11.972244.8%4.2%(+0.615)#1553.8%(+0.982)#9,183
12.972134.7%4.2%(+0.565)#1563.8%(+0.932)#9,324
13.972184.7%4.2%(+0.558)#1573.8%(+0.925)#9,342
14.972104.6%4.2%(+0.383)#1643.8%(+0.750)#9,877
15.972164.4%4.2%(+0.260)#1703.8%(+0.627)#10,275
16.972094.3%4.2%(+0.141)#1793.8%(+0.508)#10,720
17.972114.2%4.2%(+0.035)#1853.8%(+0.402)#11,116
18.972324.0%4.2%(-0.176)#1933.8%(+0.191)#11,898
19.972013.9%4.2%(-0.314)#1983.8%(+0.053)#12,468
20.972233.7%4.2%(-0.475)#2053.8%(-0.108)#13,144
21.972033.5%4.2%(-0.697)#2193.8%(-0.330)#14,075
22.972173.4%4.2%(-0.771)#2213.8%(-0.404)#14,431
23.972063.4%4.2%(-0.779)#2243.8%(-0.413)#14,470
24.972673.2%4.2%(-1.02)#2373.8%(-0.651)#15,563
25.972363.2%4.2%(-1.02)#2393.8%(-0.657)#15,596
26.972043.0%4.2%(-1.19)#2463.8%(-0.820)#16,421
27.972053.0%4.2%(-1.22)#2483.8%(-0.849)#16,559
28.972302.9%4.2%(-1.30)#2573.8%(-0.935)#16,984
29.972662.9%4.2%(-1.32)#2593.8%(-0.955)#17,079
30.972222.6%4.2%(-1.57)#2703.8%(-1.20)#18,351
31.972272.6%4.2%(-1.63)#2743.8%(-1.26)#18,645
32.972332.1%4.2%(-2.12)#3043.8%(-1.75)#21,056
33.972201.8%4.2%(-2.43)#3193.8%(-2.06)#22,436

Common Questions

What are the Top 10 Zip Codes with the Highest Percentage of Self-Employed / Incorporated in Portland, OR?
Top 10 Zip Codes with the Highest Percentage of Self-Employed / Incorporated in Portland, OR are:
#1
9.5%
#2
7.6%
#3
7.0%
#4
6.6%
#5
6.2%
#6
5.6%
#7
5.5%
#8
5.5%
#9
5.2%
#10
5.1%
What zip code has the Highest Percentage of Self-Employed / Incorporated in Portland, OR?
97221 has the Highest Percentage of Self-Employed / Incorporated in Portland, OR with 9.5%.
What is the Percentage of Self-Employed / Incorporated in Portland, OR?
Percentage of Self-Employed / Incorporated in Portland is 4.3%.
What is the Percentage of Self-Employed / Incorporated in Oregon?
Percentage of Self-Employed / Incorporated in Oregon is 4.2%.
What is the Percentage of Self-Employed / Incorporated in the United States?
Percentage of Self-Employed / Incorporated in the United States is 3.8%.