Zip Codes with the Highest Percentage of Population Employed in Arts, Entertainment & Recreation in Portland, OR

RELATED REPORTS & OPTIONS

Arts, Entertainment & Recreation
Population
Families and Households
Female Fertility
Female Fertility (Unmarried)
Race (Community Size)
Race (Percentage)
Ancestry (Community Size)
AfghanAfricanAlaska NativeAlaskan AthabascanAlbanianAleutAlsatianAmericanApacheArabArgentineanArmenianAustralianAustrianBahamianBangladeshiBasqueBelgianBelizeanBhutaneseBlackfeetBolivianBrazilianBritishBritish West IndianBulgarianBurmeseCajunCambodianCanadianCelticCentral AmericanCentral American IndianCherokeeCheyenneChickasawChileanChineseChippewaChoctawColombianColvilleCosta RicanCreeCreekCroatianCubanCzechCzechoslovakianDanishDelawareDominicanDutchEastern EuropeanEcuadorianEgyptianEnglishEstonianEthiopianEuropeanFijianFilipinoFinnishFrenchFrench American IndianFrench CanadianGermanGerman RussianGhanaianGreekGuamanian / ChamorroGuatemalanGuyaneseHaitianHonduranHopiHungarianIcelanderIndian (Asian)IndonesianInupiatIranianIraqiIrishIroquoisIsraeliItalianJamaicanJapaneseJordanianKenyanKoreanLaotianLatvianLebaneseLiberianLithuanianLumbeeLuxembourgerMacedonianMalaysianMalteseMarshalleseMexicanMexican American IndianMongolianMoroccanNative HawaiianNavajoNepaleseNew ZealanderNicaraguanNigerianNorthern EuropeanNorwegianOkinawanOsagePaiutePakistaniPalestinianPanamanianParaguayanPennsylvania GermanPeruvianPimaPolishPortuguesePotawatomiPuebloPuerto RicanPuget Sound SalishRomanianRussianSalvadoranSamoanScandinavianScotch-IrishScottishSeminoleSenegaleseSerbianShoshoneSierra LeoneanSiouxSlavicSlovakSloveneSomaliSouth AfricanSouth AmericanSouth American IndianSoviet UnionSpaniardSpanishSpanish AmericanSpanish American IndianSri LankanSubsaharan AfricanSwedishSwissSyrianThaiTlingit-HaidaTonganTrinidadian and TobagonianTsimshianTurkishUgandanUkrainianUruguayanUteVenezuelanVietnameseWelshWest IndianYakamaYaquiYugoslavianYup'ik
Ancestry (Percentage)
AfghanAfricanAlaska NativeAlaskan AthabascanAlbanianAleutAlsatianAmericanApacheArabArgentineanArmenianAustralianAustrianBahamianBangladeshiBasqueBelgianBelizeanBhutaneseBlackfeetBolivianBrazilianBritishBritish West IndianBulgarianBurmeseCajunCambodianCanadianCelticCentral AmericanCentral American IndianCherokeeCheyenneChickasawChileanChineseChippewaChoctawColombianColvilleCosta RicanCreeCreekCroatianCubanCzechCzechoslovakianDanishDelawareDominicanDutchEastern EuropeanEcuadorianEgyptianEnglishEstonianEthiopianEuropeanFijianFilipinoFinnishFrenchFrench American IndianFrench CanadianGermanGerman RussianGhanaianGreekGuamanian / ChamorroGuatemalanGuyaneseHaitianHonduranHopiHungarianIcelanderIndian (Asian)IndonesianInupiatIranianIraqiIrishIroquoisIsraeliItalianJamaicanJapaneseJordanianKenyanKoreanLaotianLatvianLebaneseLiberianLithuanianLumbeeLuxembourgerMacedonianMalaysianMalteseMarshalleseMexicanMexican American IndianMongolianMoroccanNative HawaiianNavajoNepaleseNew ZealanderNicaraguanNigerianNorthern EuropeanNorwegianOkinawanOsagePaiutePakistaniPalestinianPanamanianParaguayanPennsylvania GermanPeruvianPimaPolishPortuguesePotawatomiPuebloPuerto RicanPuget Sound SalishRomanianRussianSalvadoranSamoanScandinavianScotch-IrishScottishSeminoleSenegaleseSerbianShoshoneSierra LeoneanSiouxSlavicSlovakSloveneSomaliSouth AfricanSouth AmericanSouth American IndianSoviet UnionSpaniardSpanishSpanish AmericanSpanish American IndianSri LankanSubsaharan AfricanSwedishSwissSyrianThaiTlingit-HaidaTonganTrinidadian and TobagonianTsimshianTurkishUgandanUkrainianUruguayanUteVenezuelanVietnameseWelshWest IndianYakamaYaquiYugoslavianYup'ik
Immigrant Origin (Total)
AfghanistanAfricaArgentinaArmeniaAsiaAustraliaAustriaBahamasBangladeshBarbadosBelarusBelgiumBelizeBosnia and HerzegovinaBrazilBulgariaBurma / MyanmarCambodiaCameroonCanadaCaribbeanCentral AmericaChileChinaColombiaCongoCosta RicaCroatiaCubaCzechoslovakiaDenmarkDominican RepublicEastern AfricaEastern AsiaEastern EuropeEcuadorEgyptEl SalvadorEnglandEritreaEthiopiaEuropeFijiFranceGermanyGhanaGreeceGuatemalaHaitiHondurasHong KongHungaryIndiaIndonesiaIranIraqIrelandIsraelItalyJamaicaJapanJordanKazakhstanKenyaKoreaKuwaitLaosLatin AmericaLatviaLebanonLiberiaLithuaniaMalaysiaMexicoMicronesiaMiddle AfricaMoldovaMoroccoNepalNetherlandsNicaraguaNigeriaNorth MacedoniaNorthern AfricaNorthern EuropeNorwayOceaniaPakistanPanamaPeruPhilippinesPolandPortugalRomaniaRussiaSaudi ArabiaScotlandSerbiaSingaporeSomaliaSouth AfricaSouth AmericaSouth Central AsiaSouth Eastern AsiaSouthern EuropeSpainSri LankaSudanSwedenSwitzerlandSyriaTaiwanThailandTrinidad and TobagoTurkeyUgandaUkraineUruguayUzbekistanVenezuelaVietnamWestern AfricaWestern AsiaWestern EuropeYemen
Immigrant Origin (Percentage)
AfghanistanAfricaArgentinaArmeniaAsiaAustraliaAustriaBahamasBangladeshBarbadosBelarusBelgiumBelizeBosnia and HerzegovinaBrazilBulgariaBurma / MyanmarCambodiaCameroonCanadaCaribbeanCentral AmericaChileChinaColombiaCongoCosta RicaCroatiaCubaCzechoslovakiaDenmarkDominican RepublicEastern AfricaEastern AsiaEastern EuropeEcuadorEgyptEl SalvadorEnglandEritreaEthiopiaEuropeFijiFranceGermanyGhanaGreeceGuatemalaHaitiHondurasHong KongHungaryIndiaIndonesiaIranIraqIrelandIsraelItalyJamaicaJapanJordanKazakhstanKenyaKoreaKuwaitLaosLatin AmericaLatviaLebanonLiberiaLithuaniaMalaysiaMexicoMicronesiaMiddle AfricaMoldovaMoroccoNepalNetherlandsNicaraguaNigeriaNorth MacedoniaNorthern AfricaNorthern EuropeNorwayOceaniaPakistanPanamaPeruPhilippinesPolandPortugalRomaniaRussiaSaudi ArabiaScotlandSerbiaSingaporeSomaliaSouth AfricaSouth AmericaSouth Central AsiaSouth Eastern AsiaSouthern EuropeSpainSri LankaSudanSwedenSwitzerlandSyriaTaiwanThailandTrinidad and TobagoTurkeyUgandaUkraineUruguayUzbekistanVenezuelaVietnamWestern AfricaWestern AsiaWestern EuropeYemen
Income
Income (Families)
Income (Households)
Poverty
Poverty (Families)
Unemployment
Employment Occupations
Employment Industries
Employer Class
Commute Time
Commute Means
School Enrollment
Education by Degree Field
Occupancy
Finances
Physical Characteristics
Portland
Compare Zip Codes
Comparison Subject

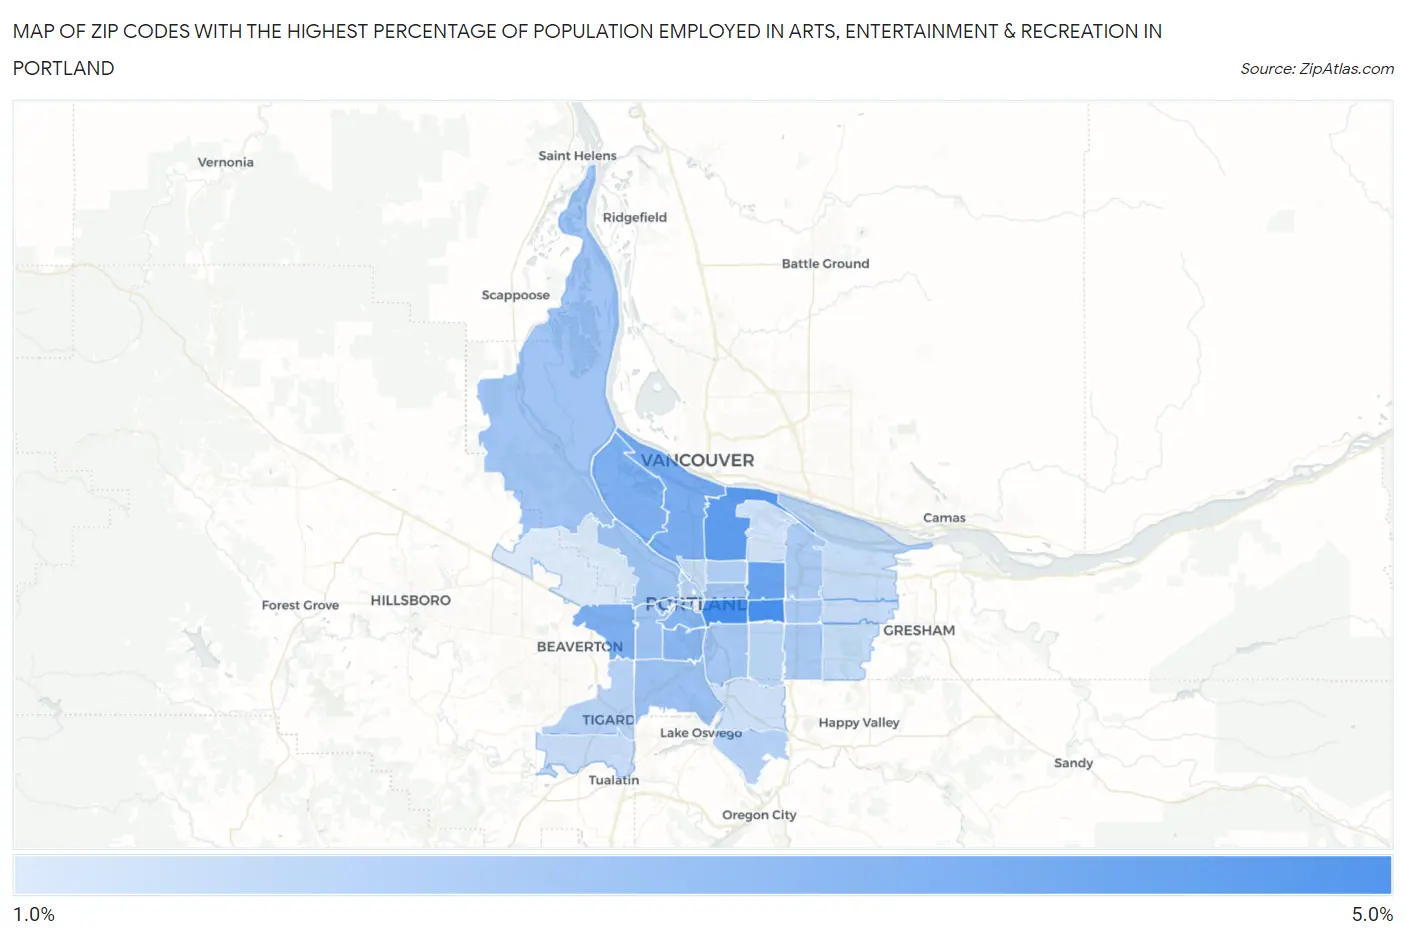
Map of Zip Codes with the Highest Percentage of Population Employed in Arts, Entertainment & Recreation in Portland

0.0%
5.0%
Zip Codes with the Highest Percentage of Population Employed in Arts, Entertainment & Recreation in Portland Map

Zip Codes with the Highest Percentage of Population Employed in Arts, Entertainment & Recreation in Portland, OR

Zip Code % Employed vs State vs National
1.972154.5%2.1%(+2.36)#562.1%(+2.37)#2,797
2.972144.4%2.1%(+2.35)#572.1%(+2.36)#2,802
3.972113.9%2.1%(+1.84)#662.1%(+1.86)#3,419
4.972133.6%2.1%(+1.55)#712.1%(+1.56)#3,865
5.972173.3%2.1%(+1.20)#762.1%(+1.22)#4,571
6.972253.2%2.1%(+1.09)#792.1%(+1.10)#4,841
7.972033.2%2.1%(+1.06)#802.1%(+1.08)#4,906
8.972013.0%2.1%(+0.864)#862.1%(+0.876)#5,481
9.972392.9%2.1%(+0.829)#882.1%(+0.841)#5,584
10.972192.5%2.1%(+0.450)#1012.1%(+0.462)#6,974
11.972052.5%2.1%(+0.437)#1032.1%(+0.449)#7,043
12.972212.4%2.1%(+0.344)#1052.1%(+0.356)#7,464
13.972102.4%2.1%(+0.337)#1072.1%(+0.349)#7,499
14.972322.4%2.1%(+0.315)#1102.1%(+0.327)#7,598
15.972312.4%2.1%(+0.284)#1122.1%(+0.296)#7,751
16.972022.3%2.1%(+0.206)#1182.1%(+0.218)#8,121
17.972662.2%2.1%(+0.083)#1272.1%(+0.095)#8,771
18.972162.2%2.1%(+0.063)#1302.1%(+0.075)#8,880
19.972202.1%2.1%(+0.038)#1322.1%(+0.050)#9,031
20.972122.0%2.1%(-0.102)#1432.1%(-0.090)#9,824
21.972671.9%2.1%(-0.176)#1502.1%(-0.164)#10,270
22.972231.9%2.1%(-0.229)#1542.1%(-0.217)#10,579
23.972091.9%2.1%(-0.239)#1552.1%(-0.227)#10,660
24.972061.7%2.1%(-0.358)#1662.1%(-0.345)#11,471
25.972361.6%2.1%(-0.525)#1822.1%(-0.513)#12,705
26.972271.6%2.1%(-0.544)#1852.1%(-0.532)#12,853
27.972301.5%2.1%(-0.546)#1862.1%(-0.533)#12,866
28.972241.5%2.1%(-0.582)#1882.1%(-0.570)#13,159
29.972331.5%2.1%(-0.614)#1932.1%(-0.602)#13,372
30.972221.3%2.1%(-0.747)#2062.1%(-0.735)#14,382
31.972181.3%2.1%(-0.778)#2112.1%(-0.766)#14,587
32.972291.0%2.1%(-1.06)#2262.1%(-1.05)#16,684

Common Questions

What are the Top 10 Zip Codes with the Highest Percentage of Population Employed in Arts, Entertainment & Recreation in Portland, OR?
Top 10 Zip Codes with the Highest Percentage of Population Employed in Arts, Entertainment & Recreation in Portland, OR are:
#1
4.5%
#2
4.4%
#3
3.9%
#4
3.6%
#5
3.3%
#6
3.2%
#7
3.2%
#8
3.0%
#9
2.9%
#10
2.5%
What zip code has the Highest Percentage of Population Employed in Arts, Entertainment & Recreation in Portland, OR?
97215 has the Highest Percentage of Population Employed in Arts, Entertainment & Recreation in Portland, OR with 4.5%.
What is the Percentage of Population Employed in Arts, Entertainment & Recreation in Portland, OR?
Percentage of Population Employed in Arts, Entertainment & Recreation in Portland is 2.6%.
What is the Percentage of Population Employed in Arts, Entertainment & Recreation in Oregon?
Percentage of Population Employed in Arts, Entertainment & Recreation in Oregon is 2.1%.
What is the Percentage of Population Employed in Arts, Entertainment & Recreation in the United States?
Percentage of Population Employed in Arts, Entertainment & Recreation in the United States is 2.1%.