Zip Codes with the Highest Percentage of Renter-Occupied Units in Portland, OR

RELATED REPORTS & OPTIONS

Highest Renter-Occupied
Population
Families and Households
Female Fertility
Female Fertility (Unmarried)
Race (Community Size)
Race (Percentage)
Ancestry (Community Size)
AfghanAfricanAlaska NativeAlaskan AthabascanAlbanianAleutAlsatianAmericanApacheArabArgentineanArmenianAustralianAustrianBahamianBangladeshiBasqueBelgianBelizeanBhutaneseBlackfeetBolivianBrazilianBritishBritish West IndianBulgarianBurmeseCajunCambodianCanadianCelticCentral AmericanCentral American IndianCherokeeCheyenneChickasawChileanChineseChippewaChoctawColombianColvilleCosta RicanCreeCreekCroatianCubanCzechCzechoslovakianDanishDelawareDominicanDutchEastern EuropeanEcuadorianEgyptianEnglishEstonianEthiopianEuropeanFijianFilipinoFinnishFrenchFrench American IndianFrench CanadianGermanGerman RussianGhanaianGreekGuamanian / ChamorroGuatemalanGuyaneseHaitianHonduranHopiHungarianIcelanderIndian (Asian)IndonesianInupiatIranianIraqiIrishIroquoisIsraeliItalianJamaicanJapaneseJordanianKenyanKoreanLaotianLatvianLebaneseLiberianLithuanianLumbeeLuxembourgerMacedonianMalaysianMalteseMarshalleseMexicanMexican American IndianMongolianMoroccanNative HawaiianNavajoNepaleseNew ZealanderNicaraguanNigerianNorthern EuropeanNorwegianOkinawanOsagePaiutePakistaniPalestinianPanamanianParaguayanPennsylvania GermanPeruvianPimaPolishPortuguesePotawatomiPuebloPuerto RicanPuget Sound SalishRomanianRussianSalvadoranSamoanScandinavianScotch-IrishScottishSeminoleSenegaleseSerbianShoshoneSierra LeoneanSiouxSlavicSlovakSloveneSomaliSouth AfricanSouth AmericanSouth American IndianSoviet UnionSpaniardSpanishSpanish AmericanSpanish American IndianSri LankanSubsaharan AfricanSwedishSwissSyrianThaiTlingit-HaidaTonganTrinidadian and TobagonianTsimshianTurkishUgandanUkrainianUruguayanUteVenezuelanVietnameseWelshWest IndianYakamaYaquiYugoslavianYup'ik
Ancestry (Percentage)
AfghanAfricanAlaska NativeAlaskan AthabascanAlbanianAleutAlsatianAmericanApacheArabArgentineanArmenianAustralianAustrianBahamianBangladeshiBasqueBelgianBelizeanBhutaneseBlackfeetBolivianBrazilianBritishBritish West IndianBulgarianBurmeseCajunCambodianCanadianCelticCentral AmericanCentral American IndianCherokeeCheyenneChickasawChileanChineseChippewaChoctawColombianColvilleCosta RicanCreeCreekCroatianCubanCzechCzechoslovakianDanishDelawareDominicanDutchEastern EuropeanEcuadorianEgyptianEnglishEstonianEthiopianEuropeanFijianFilipinoFinnishFrenchFrench American IndianFrench CanadianGermanGerman RussianGhanaianGreekGuamanian / ChamorroGuatemalanGuyaneseHaitianHonduranHopiHungarianIcelanderIndian (Asian)IndonesianInupiatIranianIraqiIrishIroquoisIsraeliItalianJamaicanJapaneseJordanianKenyanKoreanLaotianLatvianLebaneseLiberianLithuanianLumbeeLuxembourgerMacedonianMalaysianMalteseMarshalleseMexicanMexican American IndianMongolianMoroccanNative HawaiianNavajoNepaleseNew ZealanderNicaraguanNigerianNorthern EuropeanNorwegianOkinawanOsagePaiutePakistaniPalestinianPanamanianParaguayanPennsylvania GermanPeruvianPimaPolishPortuguesePotawatomiPuebloPuerto RicanPuget Sound SalishRomanianRussianSalvadoranSamoanScandinavianScotch-IrishScottishSeminoleSenegaleseSerbianShoshoneSierra LeoneanSiouxSlavicSlovakSloveneSomaliSouth AfricanSouth AmericanSouth American IndianSoviet UnionSpaniardSpanishSpanish AmericanSpanish American IndianSri LankanSubsaharan AfricanSwedishSwissSyrianThaiTlingit-HaidaTonganTrinidadian and TobagonianTsimshianTurkishUgandanUkrainianUruguayanUteVenezuelanVietnameseWelshWest IndianYakamaYaquiYugoslavianYup'ik
Immigrant Origin (Total)
AfghanistanAfricaArgentinaArmeniaAsiaAustraliaAustriaBahamasBangladeshBarbadosBelarusBelgiumBelizeBosnia and HerzegovinaBrazilBulgariaBurma / MyanmarCambodiaCameroonCanadaCaribbeanCentral AmericaChileChinaColombiaCongoCosta RicaCroatiaCubaCzechoslovakiaDenmarkDominican RepublicEastern AfricaEastern AsiaEastern EuropeEcuadorEgyptEl SalvadorEnglandEritreaEthiopiaEuropeFijiFranceGermanyGhanaGreeceGuatemalaHaitiHondurasHong KongHungaryIndiaIndonesiaIranIraqIrelandIsraelItalyJamaicaJapanJordanKazakhstanKenyaKoreaKuwaitLaosLatin AmericaLatviaLebanonLiberiaLithuaniaMalaysiaMexicoMicronesiaMiddle AfricaMoldovaMoroccoNepalNetherlandsNicaraguaNigeriaNorth MacedoniaNorthern AfricaNorthern EuropeNorwayOceaniaPakistanPanamaPeruPhilippinesPolandPortugalRomaniaRussiaSaudi ArabiaScotlandSerbiaSingaporeSomaliaSouth AfricaSouth AmericaSouth Central AsiaSouth Eastern AsiaSouthern EuropeSpainSri LankaSudanSwedenSwitzerlandSyriaTaiwanThailandTrinidad and TobagoTurkeyUgandaUkraineUruguayUzbekistanVenezuelaVietnamWestern AfricaWestern AsiaWestern EuropeYemen
Immigrant Origin (Percentage)
AfghanistanAfricaArgentinaArmeniaAsiaAustraliaAustriaBahamasBangladeshBarbadosBelarusBelgiumBelizeBosnia and HerzegovinaBrazilBulgariaBurma / MyanmarCambodiaCameroonCanadaCaribbeanCentral AmericaChileChinaColombiaCongoCosta RicaCroatiaCubaCzechoslovakiaDenmarkDominican RepublicEastern AfricaEastern AsiaEastern EuropeEcuadorEgyptEl SalvadorEnglandEritreaEthiopiaEuropeFijiFranceGermanyGhanaGreeceGuatemalaHaitiHondurasHong KongHungaryIndiaIndonesiaIranIraqIrelandIsraelItalyJamaicaJapanJordanKazakhstanKenyaKoreaKuwaitLaosLatin AmericaLatviaLebanonLiberiaLithuaniaMalaysiaMexicoMicronesiaMiddle AfricaMoldovaMoroccoNepalNetherlandsNicaraguaNigeriaNorth MacedoniaNorthern AfricaNorthern EuropeNorwayOceaniaPakistanPanamaPeruPhilippinesPolandPortugalRomaniaRussiaSaudi ArabiaScotlandSerbiaSingaporeSomaliaSouth AfricaSouth AmericaSouth Central AsiaSouth Eastern AsiaSouthern EuropeSpainSri LankaSudanSwedenSwitzerlandSyriaTaiwanThailandTrinidad and TobagoTurkeyUgandaUkraineUruguayUzbekistanVenezuelaVietnamWestern AfricaWestern AsiaWestern EuropeYemen
Income
Income (Families)
Income (Households)
Poverty
Poverty (Families)
Unemployment
Employment Occupations
Employment Industries
Employer Class
Commute Time
Commute Means
School Enrollment
Education by Degree Field
Occupancy
Finances
Physical Characteristics
Portland
Compare Zip Codes
Comparison Subject

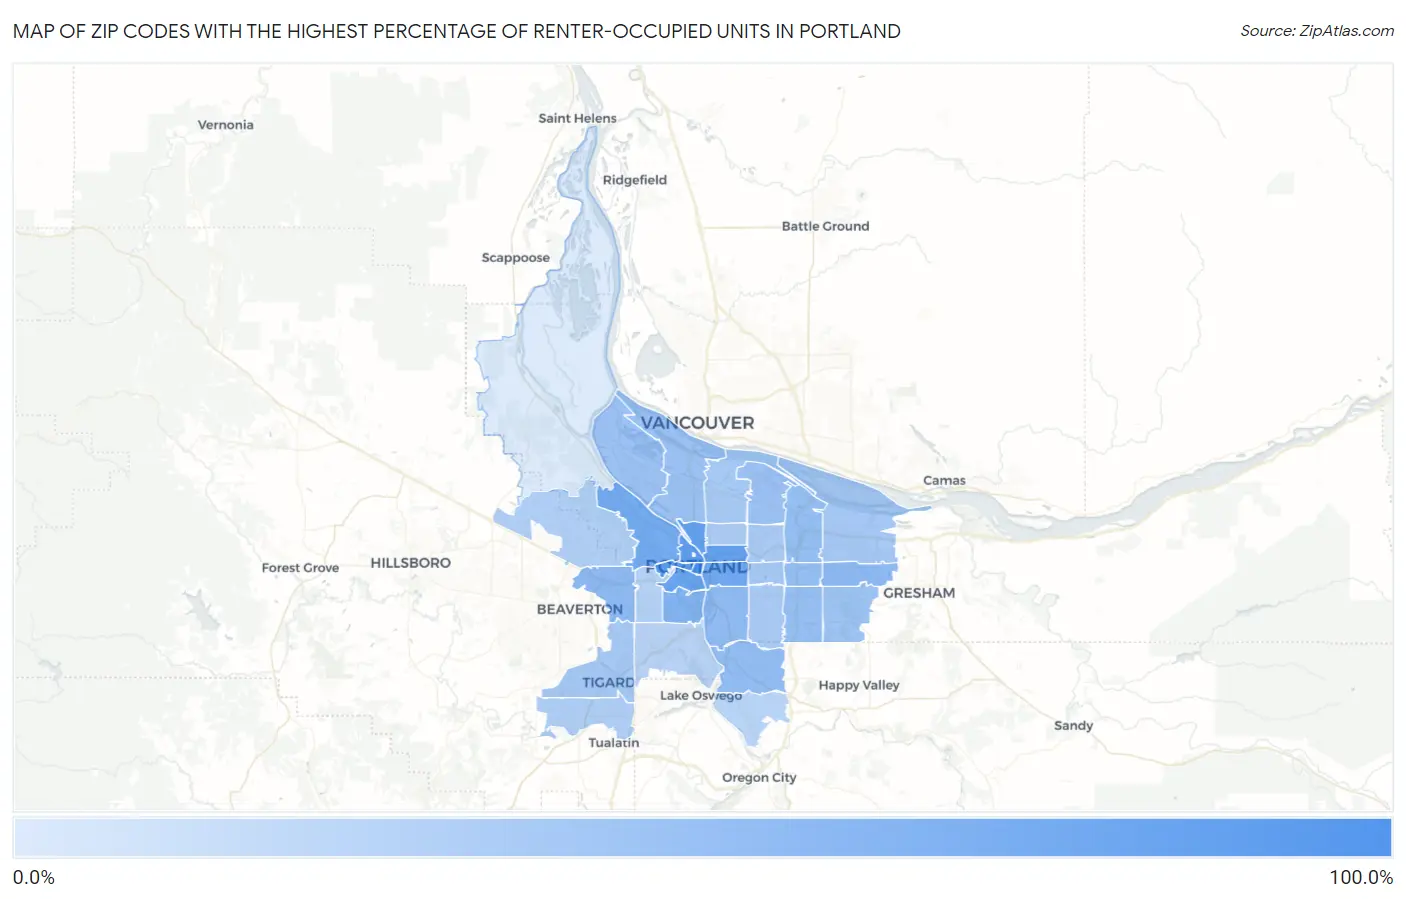
Map of Zip Codes with the Highest Percentage of Renter-Occupied Units in Portland

0.0%
100.0%
Zip Codes with the Highest Percentage of Renter-Occupied Units in Portland Map

Zip Codes with the Highest Percentage of Renter-Occupied Units in Portland, OR

Zip Code % Renter-Occupied vs State vs National
1.9720493.9%36.8%(+57.1)#335.2%(+58.7)#393
2.9720579.6%36.8%(+42.9)#535.2%(+44.5)#682
3.9720977.5%36.8%(+40.8)#635.2%(+42.4)#757
4.9722774.7%36.8%(+37.9)#735.2%(+39.5)#846
5.9723273.1%36.8%(+36.3)#835.2%(+37.9)#908
6.9720171.4%36.8%(+34.6)#935.2%(+36.2)#990
7.9721466.6%36.8%(+29.8)#1635.2%(+31.4)#1,267
8.9721063.9%36.8%(+27.1)#1835.2%(+28.7)#1,469
9.9723955.3%36.8%(+18.5)#2935.2%(+20.1)#2,298
10.9723349.1%36.8%(+12.3)#4035.2%(+13.9)#3,244
11.9722548.8%36.8%(+12.0)#4135.2%(+13.6)#3,319
12.9720248.1%36.8%(+11.4)#4435.2%(+13.0)#3,418
13.9722245.8%36.8%(+9.04)#5235.2%(+10.6)#3,885
14.9722045.3%36.8%(+8.51)#5435.2%(+10.1)#3,989
15.9721644.8%36.8%(+8.04)#5535.2%(+9.64)#4,105
16.9726643.4%36.8%(+6.62)#6335.2%(+8.23)#4,465
17.9721742.6%36.8%(+5.77)#6635.2%(+7.37)#4,701
18.9721841.6%36.8%(+4.79)#7035.2%(+6.39)#4,942
19.9720341.2%36.8%(+4.41)#7235.2%(+6.02)#5,045
20.9723639.9%36.8%(+3.11)#8035.2%(+4.71)#5,439
21.9722337.3%36.8%(+0.506)#10035.2%(+2.11)#6,351
22.9723036.9%36.8%(+0.148)#10535.2%(+1.75)#6,519
23.9721536.9%36.8%(+0.106)#10735.2%(+1.71)#6,539
24.9721135.3%36.8%(-1.49)#12435.2%(+0.113)#7,208
25.9720634.9%36.8%(-1.93)#12935.2%(-0.329)#7,422
26.9721334.7%36.8%(-2.09)#13135.2%(-0.492)#7,506
27.9721233.1%36.8%(-3.65)#14635.2%(-2.04)#8,252
28.9722432.6%36.8%(-4.18)#15235.2%(-2.58)#8,527
29.9722930.6%36.8%(-6.16)#17235.2%(-4.56)#9,654
30.9722128.8%36.8%(-7.97)#19035.2%(-6.37)#10,819
31.9721928.3%36.8%(-8.50)#19835.2%(-6.90)#11,183
32.9726727.2%36.8%(-9.62)#20935.2%(-8.02)#11,992
33.9723111.5%36.8%(-25.3)#37035.2%(-23.7)#26,201

Common Questions

What are the Top 10 Zip Codes with the Highest Percentage of Renter-Occupied Units in Portland, OR?
Top 10 Zip Codes with the Highest Percentage of Renter-Occupied Units in Portland, OR are:
#1
93.9%
#2
79.6%
#3
77.5%
#4
74.7%
#5
73.1%
#6
71.4%
#7
66.6%
#8
63.9%
#9
55.3%
#10
49.1%
What zip code has the Highest Percentage of Renter-Occupied Units in Portland, OR?
97204 has the Highest Percentage of Renter-Occupied Units in Portland, OR with 93.9%.
What is the Percentage of Renter-Occupied Units in Portland, OR?
Percentage of Renter-Occupied Units in Portland is 46.7%.
What is the Percentage of Renter-Occupied Units in Oregon?
Percentage of Renter-Occupied Units in Oregon is 36.8%.
What is the Percentage of Renter-Occupied Units in the United States?
Percentage of Renter-Occupied Units in the United States is 35.2%.