Zip Codes with the Highest Percentage of Population Employed in Health Care & Social Assistance in Hillsboro, OR

RELATED REPORTS & OPTIONS

Health Care & Social Assistance
Population
Families and Households
Female Fertility
Female Fertility (Unmarried)
Race (Community Size)
Race (Percentage)
Ancestry (Community Size)
AfricanAmericanApacheArabArmenianAssyrian / Chaldean / SyriacAustralianAustrianBangladeshiBelgianBhutaneseBlackfeetBrazilianBritishBurmeseCajunCanadianCentral AmericanCentral American IndianCherokeeChippewaChoctawColombianCosta RicanCroatianCubanCzechDanishDutchEastern EuropeanEcuadorianEnglishEstonianEuropeanFilipinoFinnishFrenchFrench CanadianGermanGhanaianGreekGuamanian / ChamorroGuatemalanHaitianHonduranHungarianIcelanderIndian (Asian)IranianIrishItalianJamaicanJapaneseKoreanLebaneseLithuanianMalaysianMexicanMexican American IndianMoroccanNative HawaiianNavajoNicaraguanNigerianNorthern EuropeanNorwegianPaiutePakistaniPanamanianPeruvianPolishPortuguesePotawatomiPuerto RicanRomanianRussianSalvadoranSamoanScandinavianScotch-IrishScottishSerbianSouth AmericanSpaniardSpanishSri LankanSubsaharan AfricanSwedishSwissThaiTlingit-HaidaTurkishUkrainianVietnameseWelshWest IndianYaqui
Ancestry (Percentage)
AfricanAmericanApacheArabArmenianAssyrian / Chaldean / SyriacAustralianAustrianBangladeshiBelgianBhutaneseBlackfeetBrazilianBritishBurmeseCajunCanadianCentral AmericanCentral American IndianCherokeeChippewaChoctawColombianCosta RicanCroatianCubanCzechDanishDutchEastern EuropeanEcuadorianEnglishEstonianEuropeanFilipinoFinnishFrenchFrench CanadianGermanGhanaianGreekGuamanian / ChamorroGuatemalanHaitianHonduranHungarianIcelanderIndian (Asian)IranianIrishItalianJamaicanJapaneseKoreanLebaneseLithuanianMalaysianMexicanMexican American IndianMoroccanNative HawaiianNavajoNicaraguanNigerianNorthern EuropeanNorwegianPaiutePakistaniPanamanianPeruvianPolishPortuguesePotawatomiPuerto RicanRomanianRussianSalvadoranSamoanScandinavianScotch-IrishScottishSerbianSouth AmericanSpaniardSpanishSri LankanSubsaharan AfricanSwedishSwissThaiTlingit-HaidaTurkishUkrainianVietnameseWelshWest IndianYaqui
Immigrant Origin (Total)
Immigrant Origin (Percentage)
Income
Income (Families)
Income (Households)
Poverty
Poverty (Families)
Unemployment
Employment Occupations
Employment Industries
Employer Class
Commute Time
Commute Means
School Enrollment
Education by Degree Field
Occupancy
Finances
Physical Characteristics
Hillsboro
Compare Zip Codes
Comparison Subject

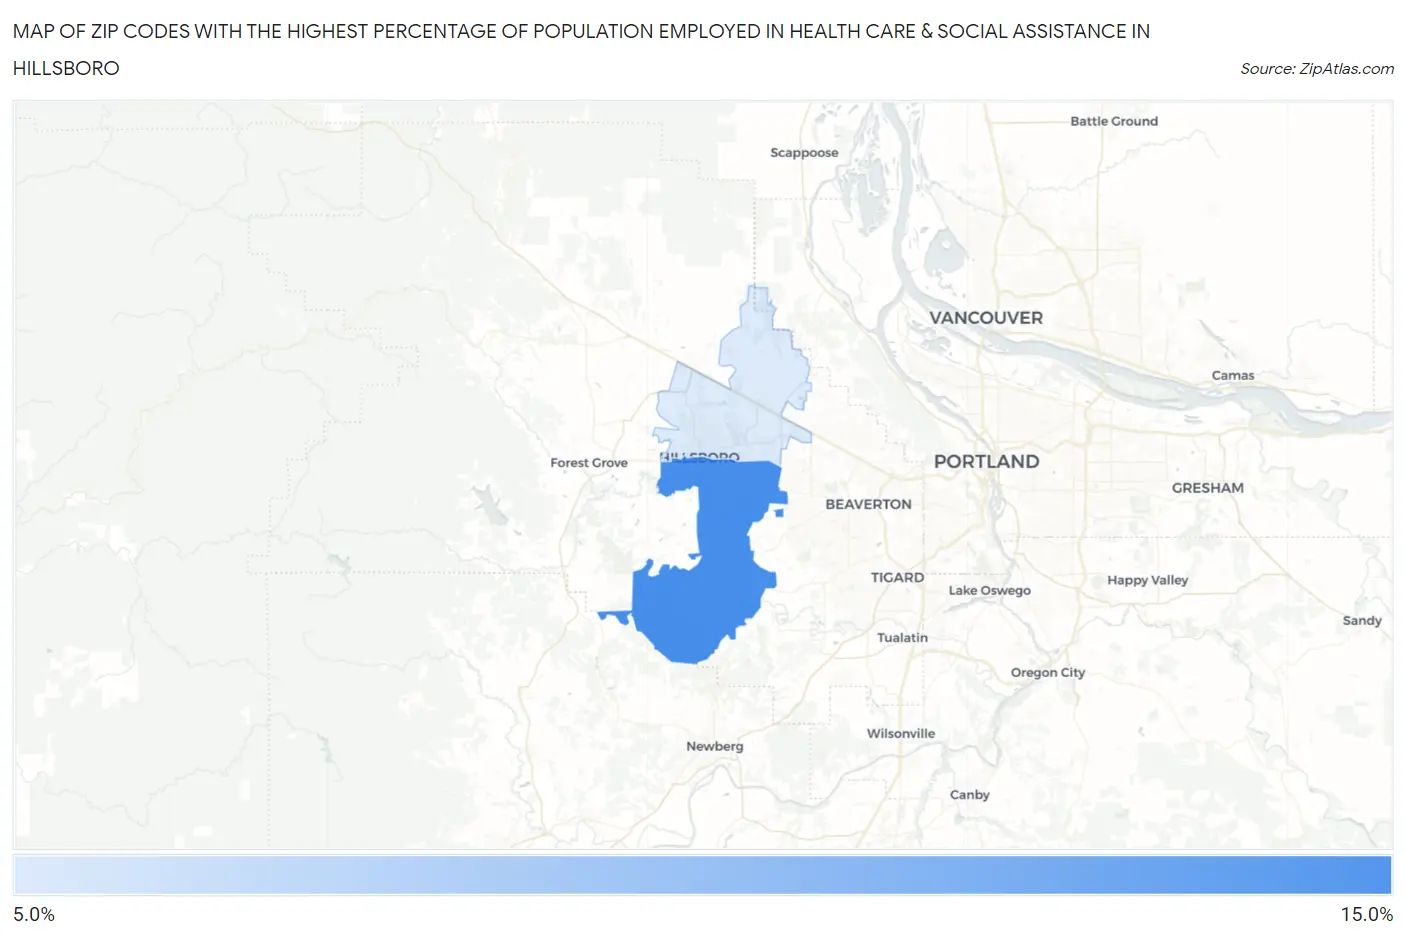
Map of Zip Codes with the Highest Percentage of Population Employed in Health Care & Social Assistance in Hillsboro

0.0%
15.0%
Zip Codes with the Highest Percentage of Population Employed in Health Care & Social Assistance in Hillsboro Map

Zip Codes with the Highest Percentage of Population Employed in Health Care & Social Assistance in Hillsboro, OR

Zip Code % Employed vs State vs National
1.9712311.2%14.8%(-3.54)#26113.9%(-2.69)#20,787
2.9712410.4%14.8%(-4.37)#27613.9%(-3.51)#22,597

Common Questions

What are the Top Zip Codes with the Highest Percentage of Population Employed in Health Care & Social Assistance in Hillsboro, OR?
Top Zip Codes with the Highest Percentage of Population Employed in Health Care & Social Assistance in Hillsboro, OR are:
#1
11.2%
#2
10.4%
What zip code has the Highest Percentage of Population Employed in Health Care & Social Assistance in Hillsboro, OR?
97123 has the Highest Percentage of Population Employed in Health Care & Social Assistance in Hillsboro, OR with 11.2%.
What is the Percentage of Population Employed in Health Care & Social Assistance in Hillsboro, OR?
Percentage of Population Employed in Health Care & Social Assistance in Hillsboro is 11.6%.
What is the Percentage of Population Employed in Health Care & Social Assistance in Oregon?
Percentage of Population Employed in Health Care & Social Assistance in Oregon is 14.8%.
What is the Percentage of Population Employed in Health Care & Social Assistance in the United States?
Percentage of Population Employed in Health Care & Social Assistance in the United States is 13.9%.