Zip Codes with the Highest Percentage of Population Employed in Arts, Entertainment & Recreation in Hillsboro, OR
RELATED REPORTS & OPTIONS
Arts, Entertainment & Recreation
Hillsboro
Compare Zip Codes
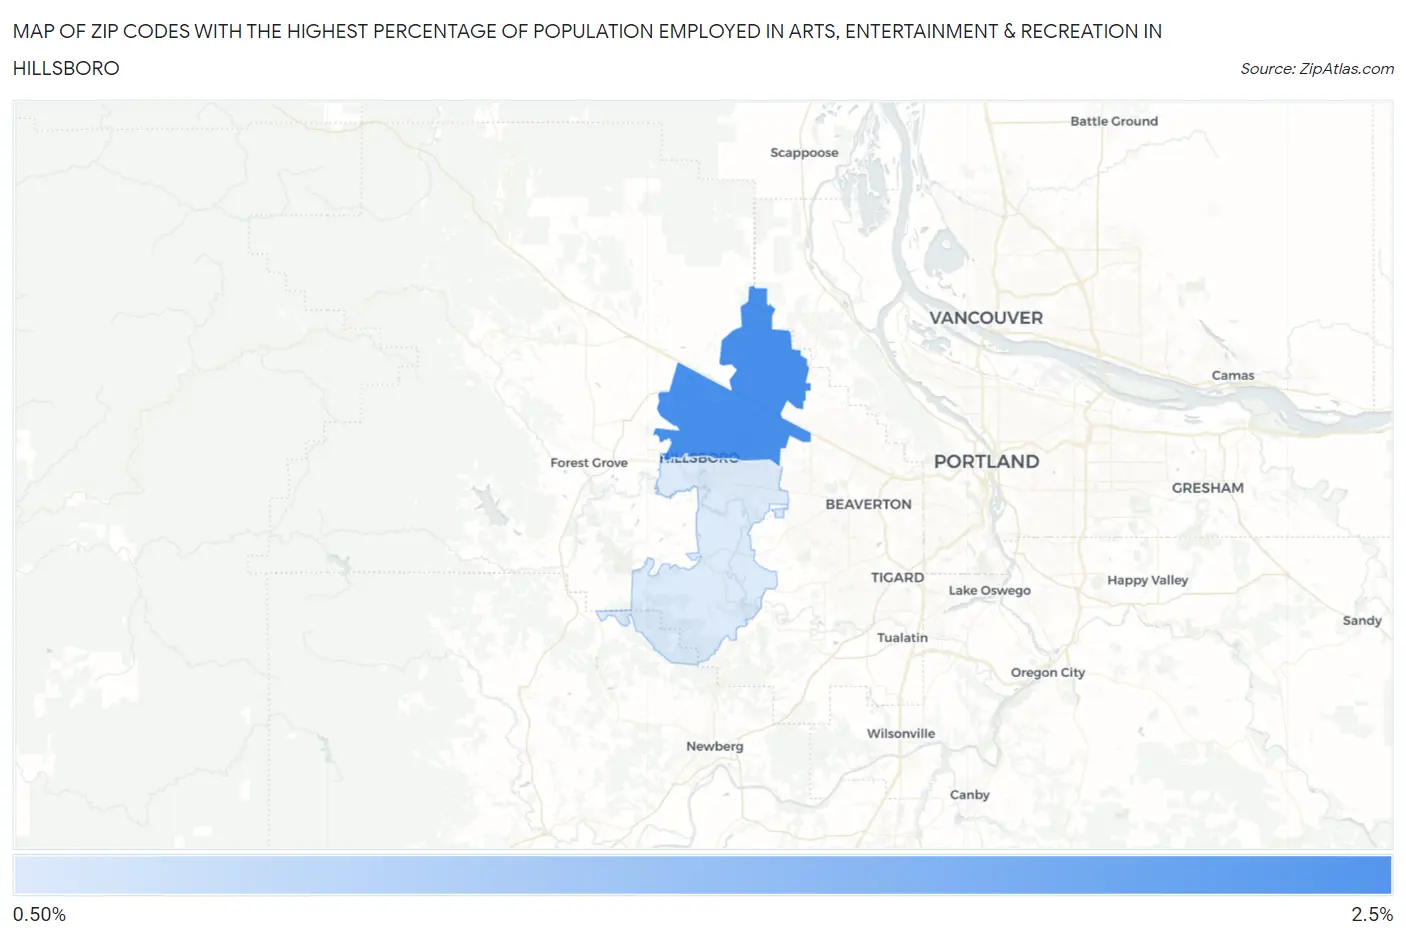
Map of Zip Codes with the Highest Percentage of Population Employed in Arts, Entertainment & Recreation in Hillsboro
0.0%
2.5%
Zip Codes with the Highest Percentage of Population Employed in Arts, Entertainment & Recreation in Hillsboro, OR
| Zip Code | % Employed | vs State | vs National | |
| 1. | 97124 | 2.3% | 2.1%(+0.158)#122 | 2.1%(+0.170)#8,372 |
| 2. | 97123 | 0.89% | 2.1%(-1.21)#237 | 2.1%(-1.20)#17,789 |
1
Common Questions
What are the Top Zip Codes with the Highest Percentage of Population Employed in Arts, Entertainment & Recreation in Hillsboro, OR?
Top Zip Codes with the Highest Percentage of Population Employed in Arts, Entertainment & Recreation in Hillsboro, OR are:
What zip code has the Highest Percentage of Population Employed in Arts, Entertainment & Recreation in Hillsboro, OR?
97124 has the Highest Percentage of Population Employed in Arts, Entertainment & Recreation in Hillsboro, OR with 2.3%.
What is the Percentage of Population Employed in Arts, Entertainment & Recreation in Hillsboro, OR?
Percentage of Population Employed in Arts, Entertainment & Recreation in Hillsboro is 1.6%.
What is the Percentage of Population Employed in Arts, Entertainment & Recreation in Oregon?
Percentage of Population Employed in Arts, Entertainment & Recreation in Oregon is 2.1%.
What is the Percentage of Population Employed in Arts, Entertainment & Recreation in the United States?
Percentage of Population Employed in Arts, Entertainment & Recreation in the United States is 2.1%.