Zip Codes with the Highest Percentage of Population Employed in Farming, Fishing & Forestry in Hillsboro, OR
RELATED REPORTS & OPTIONS
Farming, Fishing & Forestry
Hillsboro
Compare Zip Codes
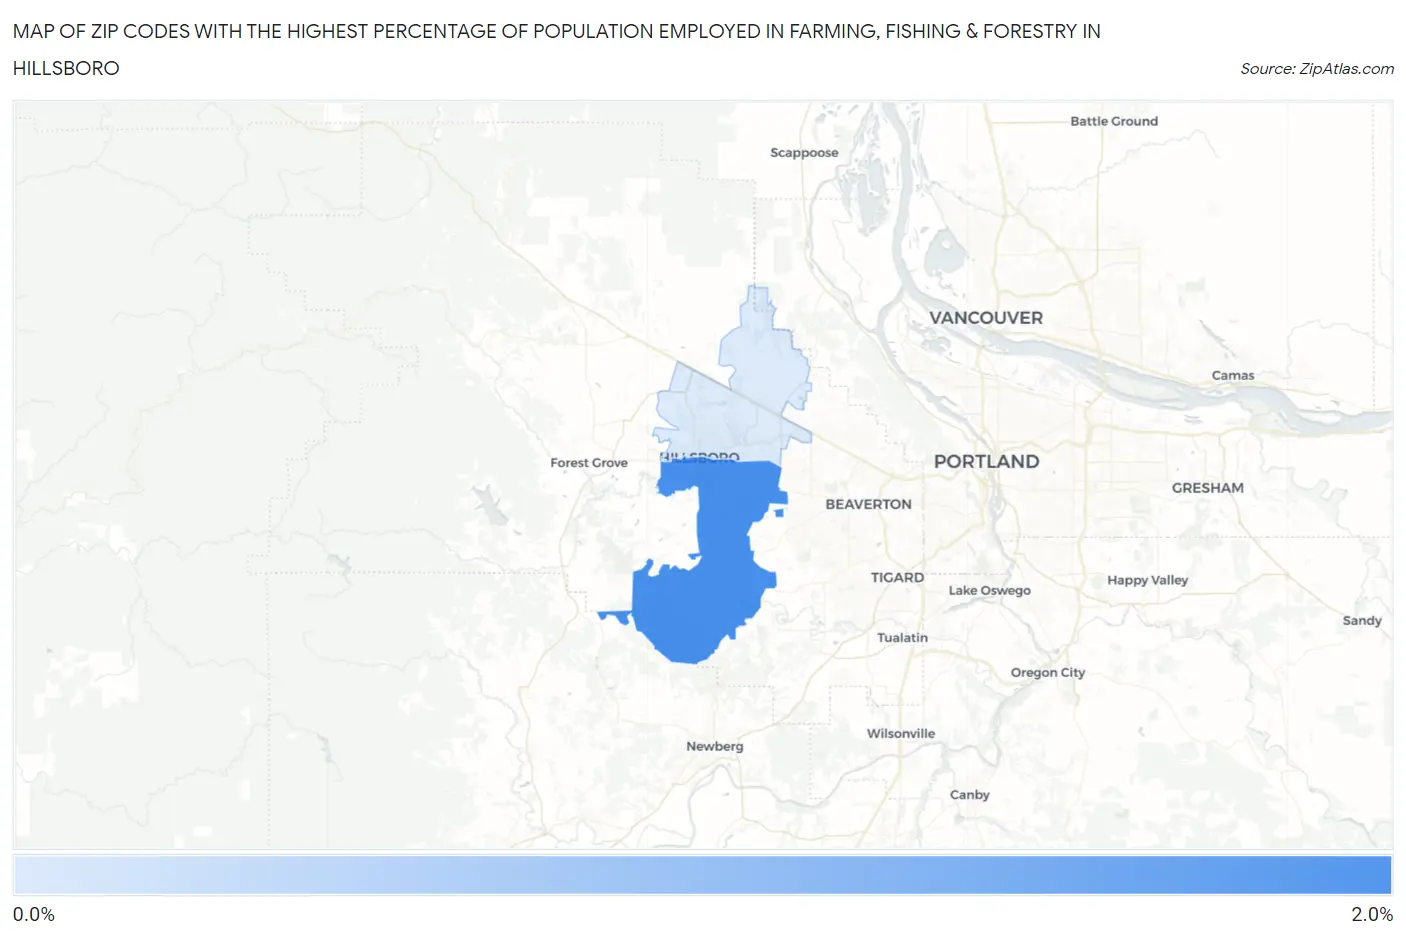
Map of Zip Codes with the Highest Percentage of Population Employed in Farming, Fishing & Forestry in Hillsboro
0.0%
2.0%
Zip Codes with the Highest Percentage of Population Employed in Farming, Fishing & Forestry in Hillsboro, OR
| Zip Code | % Employed | vs State | vs National | |
| 1. | 97123 | 1.7% | 1.4%(+0.243)#191 | 0.61%(+1.04)#7,431 |
| 2. | 97124 | 0.53% | 1.4%(-0.874)#265 | 0.61%(-0.072)#12,570 |
1
Common Questions
What are the Top Zip Codes with the Highest Percentage of Population Employed in Farming, Fishing & Forestry in Hillsboro, OR?
Top Zip Codes with the Highest Percentage of Population Employed in Farming, Fishing & Forestry in Hillsboro, OR are:
What zip code has the Highest Percentage of Population Employed in Farming, Fishing & Forestry in Hillsboro, OR?
97123 has the Highest Percentage of Population Employed in Farming, Fishing & Forestry in Hillsboro, OR with 1.7%.
What is the Percentage of Population Employed in Farming, Fishing & Forestry in Hillsboro, OR?
Percentage of Population Employed in Farming, Fishing & Forestry in Hillsboro is 0.75%.
What is the Percentage of Population Employed in Farming, Fishing & Forestry in Oregon?
Percentage of Population Employed in Farming, Fishing & Forestry in Oregon is 1.4%.
What is the Percentage of Population Employed in Farming, Fishing & Forestry in the United States?
Percentage of Population Employed in Farming, Fishing & Forestry in the United States is 0.61%.