Zip Codes with the Highest Percentage of Population Employed in Arts, Entertainment & Recreation in Gresham, OR
RELATED REPORTS & OPTIONS
Arts, Entertainment & Recreation
Gresham
Compare Zip Codes
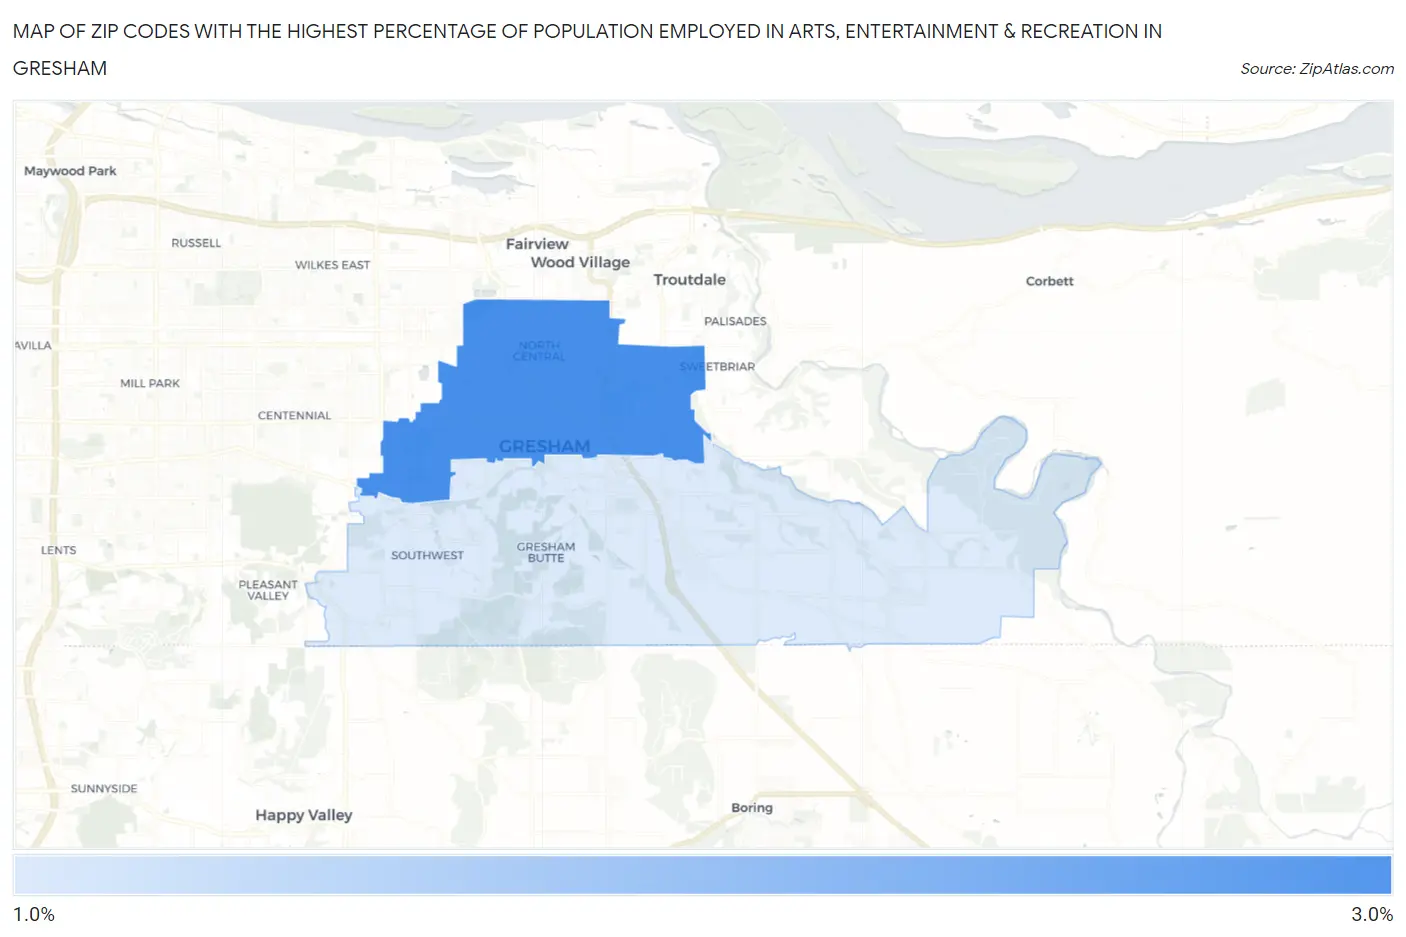
Map of Zip Codes with the Highest Percentage of Population Employed in Arts, Entertainment & Recreation in Gresham
1.4%
2.8%
Zip Codes with the Highest Percentage of Population Employed in Arts, Entertainment & Recreation in Gresham, OR
| Zip Code | % Employed | vs State | vs National | |
| 1. | 97030 | 2.8% | 2.1%(+0.737)#91 | 2.1%(+0.750)#5,880 |
| 2. | 97080 | 1.4% | 2.1%(-0.647)#198 | 2.1%(-0.635)#13,618 |
1
Common Questions
What are the Top Zip Codes with the Highest Percentage of Population Employed in Arts, Entertainment & Recreation in Gresham, OR?
Top Zip Codes with the Highest Percentage of Population Employed in Arts, Entertainment & Recreation in Gresham, OR are:
What zip code has the Highest Percentage of Population Employed in Arts, Entertainment & Recreation in Gresham, OR?
97030 has the Highest Percentage of Population Employed in Arts, Entertainment & Recreation in Gresham, OR with 2.8%.
What is the Percentage of Population Employed in Arts, Entertainment & Recreation in Gresham, OR?
Percentage of Population Employed in Arts, Entertainment & Recreation in Gresham is 1.8%.
What is the Percentage of Population Employed in Arts, Entertainment & Recreation in Oregon?
Percentage of Population Employed in Arts, Entertainment & Recreation in Oregon is 2.1%.
What is the Percentage of Population Employed in Arts, Entertainment & Recreation in the United States?
Percentage of Population Employed in Arts, Entertainment & Recreation in the United States is 2.1%.