Zip Codes with the Highest Percentage of Population Employed in Manufacturing in Bend, OR
RELATED REPORTS & OPTIONS
Manufacturing
Bend
Compare Zip Codes
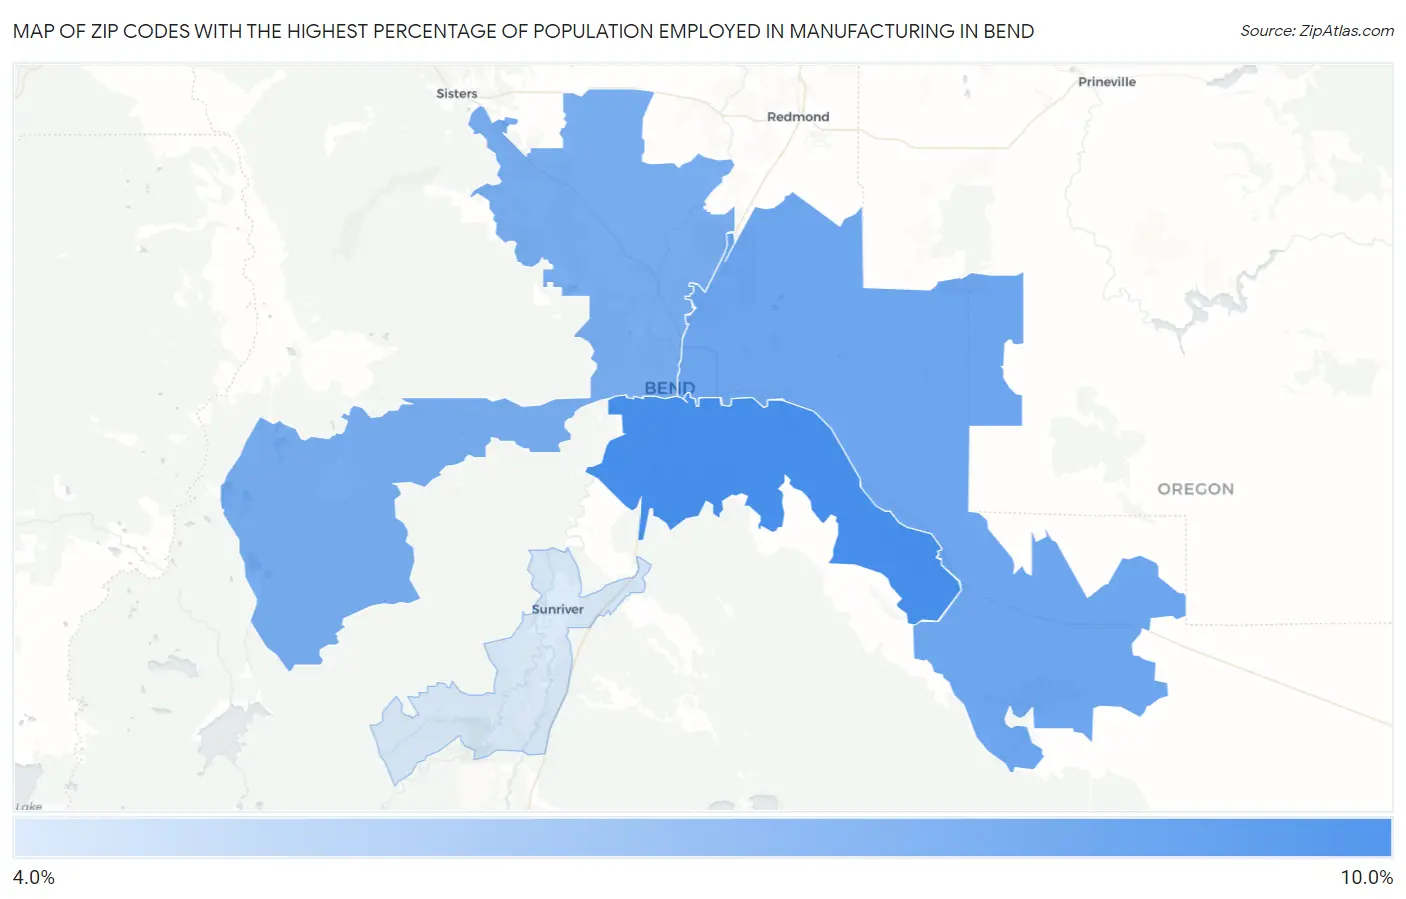
Map of Zip Codes with the Highest Percentage of Population Employed in Manufacturing in Bend
4.9%
8.0%
Zip Codes with the Highest Percentage of Population Employed in Manufacturing in Bend, OR
| Zip Code | % Employed | vs State | vs National | |
| 1. | 97702 | 8.0% | 10.8%(-2.81)#241 | 10.0%(-1.96)#19,125 |
| 2. | 97701 | 7.2% | 10.8%(-3.63)#258 | 10.0%(-2.79)#20,593 |
| 3. | 97703 | 7.0% | 10.8%(-3.86)#262 | 10.0%(-3.01)#21,030 |
| 4. | 97707 | 4.9% | 10.8%(-5.96)#302 | 10.0%(-5.11)#24,633 |
1
Common Questions
What are the Top 3 Zip Codes with the Highest Percentage of Population Employed in Manufacturing in Bend, OR?
Top 3 Zip Codes with the Highest Percentage of Population Employed in Manufacturing in Bend, OR are:
What zip code has the Highest Percentage of Population Employed in Manufacturing in Bend, OR?
97702 has the Highest Percentage of Population Employed in Manufacturing in Bend, OR with 8.0%.
What is the Percentage of Population Employed in Manufacturing in Bend, OR?
Percentage of Population Employed in Manufacturing in Bend is 7.2%.
What is the Percentage of Population Employed in Manufacturing in Oregon?
Percentage of Population Employed in Manufacturing in Oregon is 10.8%.
What is the Percentage of Population Employed in Manufacturing in the United States?
Percentage of Population Employed in Manufacturing in the United States is 10.0%.