Zip Codes with the Highest Percentage of Population Employed in Arts, Entertainment & Recreation in Beaverton, OR
RELATED REPORTS & OPTIONS
Arts, Entertainment & Recreation
Beaverton
Compare Zip Codes
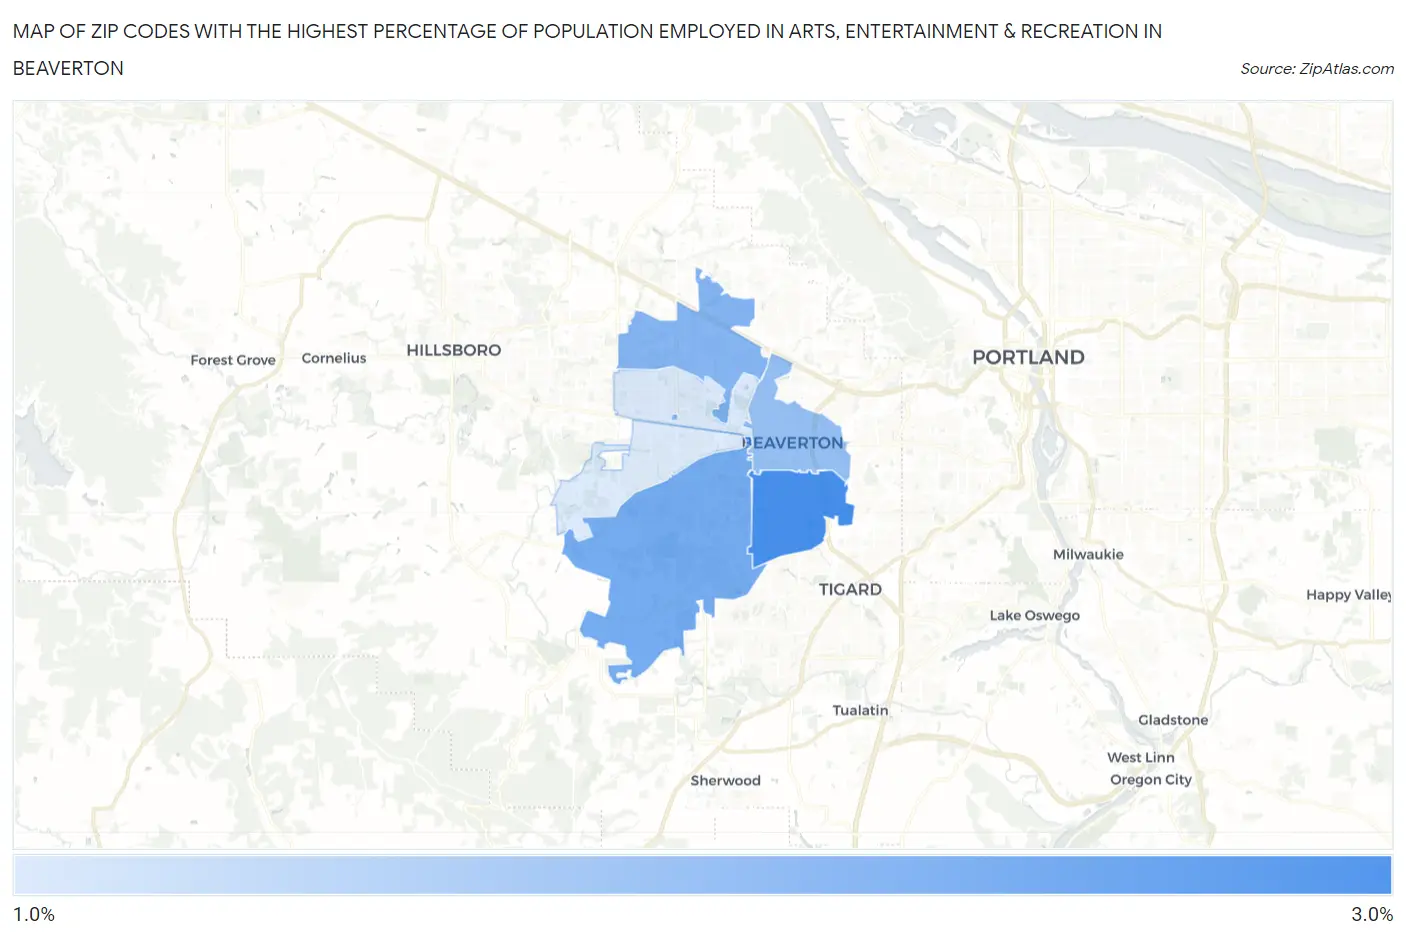
Map of Zip Codes with the Highest Percentage of Population Employed in Arts, Entertainment & Recreation in Beaverton
0.0%
3.0%
Zip Codes with the Highest Percentage of Population Employed in Arts, Entertainment & Recreation in Beaverton, OR
| Zip Code | % Employed | vs State | vs National | |
| 1. | 97008 | 2.5% | 2.1%(+0.420)#104 | 2.1%(+0.432)#7,119 |
| 2. | 97007 | 2.2% | 2.1%(+0.102)#125 | 2.1%(+0.114)#8,665 |
| 3. | 97006 | 2.1% | 2.1%(-0.011)#136 | 2.1%(+0.001)#9,301 |
| 4. | 97005 | 2.0% | 2.1%(-0.114)#145 | 2.1%(-0.102)#9,885 |
| 5. | 97003 | 1.5% | 2.1%(-0.598)#190 | 2.1%(-0.586)#13,249 |
| 6. | 97078 | 1.5% | 2.1%(-0.614)#192 | 2.1%(-0.602)#13,367 |
1
Common Questions
What are the Top 5 Zip Codes with the Highest Percentage of Population Employed in Arts, Entertainment & Recreation in Beaverton, OR?
Top 5 Zip Codes with the Highest Percentage of Population Employed in Arts, Entertainment & Recreation in Beaverton, OR are:
What zip code has the Highest Percentage of Population Employed in Arts, Entertainment & Recreation in Beaverton, OR?
97008 has the Highest Percentage of Population Employed in Arts, Entertainment & Recreation in Beaverton, OR with 2.5%.
What is the Percentage of Population Employed in Arts, Entertainment & Recreation in Beaverton, OR?
Percentage of Population Employed in Arts, Entertainment & Recreation in Beaverton is 2.3%.
What is the Percentage of Population Employed in Arts, Entertainment & Recreation in Oregon?
Percentage of Population Employed in Arts, Entertainment & Recreation in Oregon is 2.1%.
What is the Percentage of Population Employed in Arts, Entertainment & Recreation in the United States?
Percentage of Population Employed in Arts, Entertainment & Recreation in the United States is 2.1%.