Zip Codes with the Highest Percentage of Self-Employed / Incorporated in Oklahoma
RELATED REPORTS & OPTIONS
Self-Employed / Incorporated
Oklahoma
Compare Zip Codes
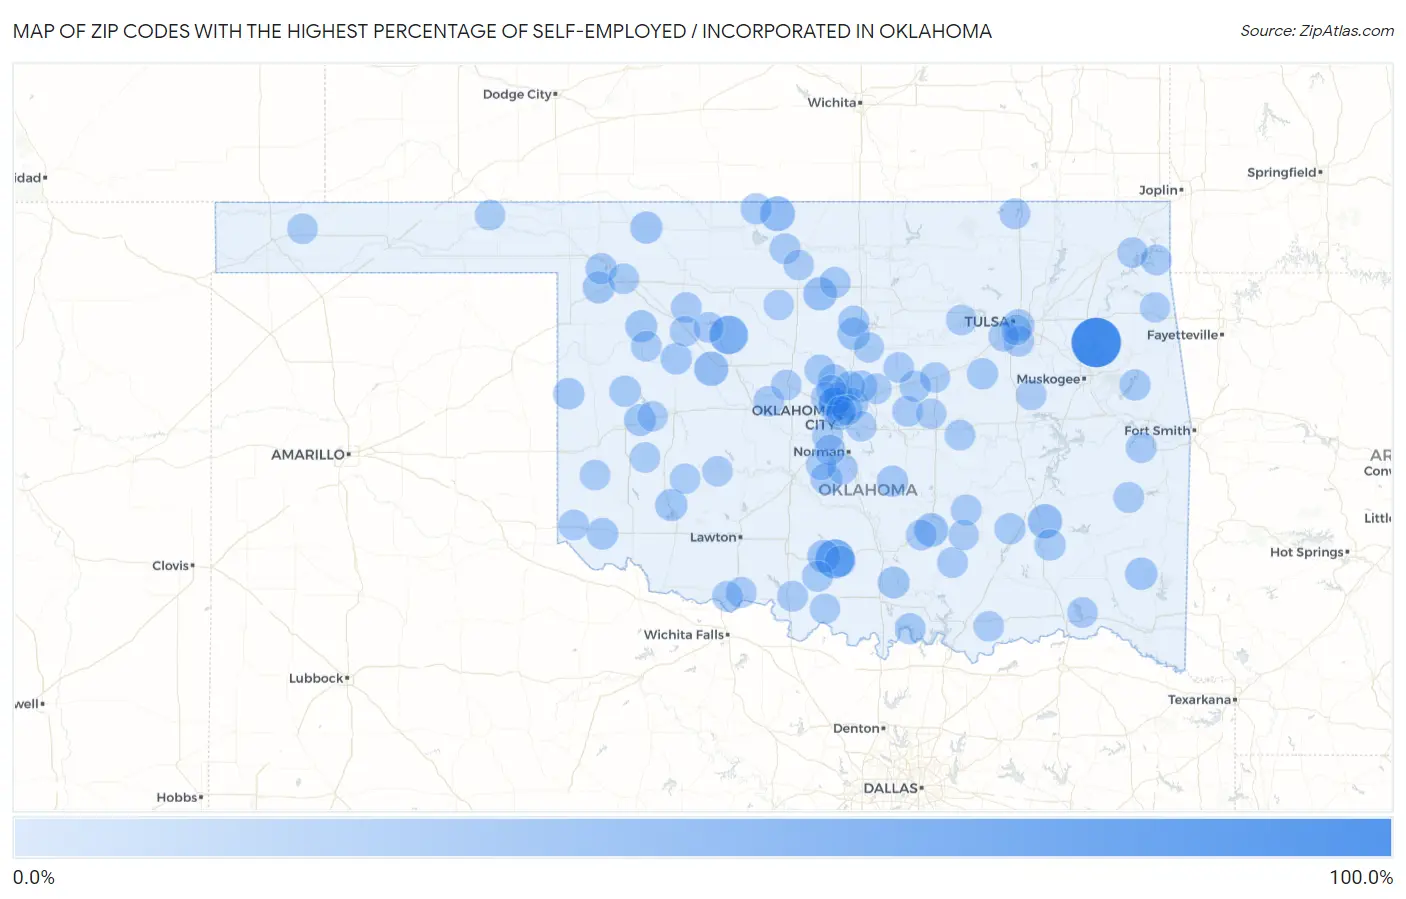
Map of Zip Codes with the Highest Percentage of Self-Employed / Incorporated in Oklahoma
0.0%
100.0%
Zip Codes with the Highest Percentage of Self-Employed / Incorporated in Oklahoma
| Zip Code | % Self-Employed / Incorporated | vs State | vs National | |
| 1. | 74477 | 100.0% | 3.7%(+96.3)#1 | 3.8%(+96.2)#25 |
| 2. | 73425 | 47.4% | 3.7%(+43.7)#2 | 3.8%(+43.6)#98 |
| 3. | 73770 | 44.4% | 3.7%(+40.8)#3 | 3.8%(+40.6)#111 |
| 4. | 73758 | 27.3% | 3.7%(+23.6)#4 | 3.8%(+23.5)#264 |
| 5. | 73646 | 24.5% | 3.7%(+20.8)#5 | 3.8%(+20.7)#325 |
| 6. | 74528 | 24.4% | 3.7%(+20.7)#6 | 3.8%(+20.6)#327 |
| 7. | 74843 | 21.8% | 3.7%(+18.1)#7 | 3.8%(+18.0)#418 |
| 8. | 73736 | 21.0% | 3.7%(+17.3)#8 | 3.8%(+17.2)#449 |
| 9. | 73491 | 17.4% | 3.7%(+13.8)#9 | 3.8%(+13.6)#669 |
| 10. | 73063 | 15.1% | 3.7%(+11.5)#10 | 3.8%(+11.3)#930 |
| 11. | 74724 | 15.0% | 3.7%(+11.3)#11 | 3.8%(+11.2)#953 |
| 12. | 73564 | 14.7% | 3.7%(+11.0)#12 | 3.8%(+10.9)#1,003 |
| 13. | 73842 | 14.6% | 3.7%(+10.9)#13 | 3.8%(+10.8)#1,027 |
| 14. | 73859 | 13.8% | 3.7%(+10.1)#14 | 3.8%(+9.97)#1,184 |
| 15. | 73840 | 12.8% | 3.7%(+9.15)#15 | 3.8%(+9.00)#1,348 |
| 16. | 73436 | 12.7% | 3.7%(+9.03)#16 | 3.8%(+8.88)#1,389 |
| 17. | 73626 | 12.4% | 3.7%(+8.76)#17 | 3.8%(+8.61)#1,468 |
| 18. | 73532 | 12.2% | 3.7%(+8.57)#18 | 3.8%(+8.42)#1,511 |
| 19. | 73116 | 11.8% | 3.7%(+8.10)#19 | 3.8%(+7.95)#1,619 |
| 20. | 73007 | 11.7% | 3.7%(+8.04)#20 | 3.8%(+7.89)#1,653 |
| 21. | 74114 | 11.5% | 3.7%(+7.86)#21 | 3.8%(+7.71)#1,713 |
| 22. | 73151 | 11.5% | 3.7%(+7.82)#22 | 3.8%(+7.67)#1,725 |
| 23. | 73659 | 11.1% | 3.7%(+7.44)#23 | 3.8%(+7.29)#1,842 |
| 24. | 73031 | 11.1% | 3.7%(+7.44)#24 | 3.8%(+7.29)#1,851 |
| 25. | 73660 | 10.6% | 3.7%(+6.96)#25 | 3.8%(+6.81)#2,056 |
| 26. | 74878 | 10.6% | 3.7%(+6.94)#26 | 3.8%(+6.79)#2,065 |
| 27. | 73025 | 10.4% | 3.7%(+6.76)#27 | 3.8%(+6.61)#2,119 |
| 28. | 73650 | 10.2% | 3.7%(+6.49)#28 | 3.8%(+6.34)#2,235 |
| 29. | 73841 | 10.0% | 3.7%(+6.38)#29 | 3.8%(+6.23)#2,291 |
| 30. | 74540 | 10.0% | 3.7%(+6.33)#30 | 3.8%(+6.18)#2,319 |
| 31. | 74071 | 10.0% | 3.7%(+6.33)#31 | 3.8%(+6.18)#2,320 |
| 32. | 73719 | 9.8% | 3.7%(+6.17)#32 | 3.8%(+6.02)#2,397 |
| 33. | 73440 | 9.8% | 3.7%(+6.12)#33 | 3.8%(+5.97)#2,424 |
| 34. | 74427 | 9.7% | 3.7%(+5.99)#34 | 3.8%(+5.84)#2,492 |
| 35. | 74576 | 9.4% | 3.7%(+5.71)#35 | 3.8%(+5.56)#2,660 |
| 36. | 73073 | 9.3% | 3.7%(+5.59)#36 | 3.8%(+5.44)#2,722 |
| 37. | 73738 | 9.2% | 3.7%(+5.50)#37 | 3.8%(+5.35)#2,780 |
| 38. | 73481 | 8.9% | 3.7%(+5.27)#38 | 3.8%(+5.12)#2,920 |
| 39. | 73016 | 8.9% | 3.7%(+5.26)#39 | 3.8%(+5.11)#2,927 |
| 40. | 73442 | 8.8% | 3.7%(+5.12)#40 | 3.8%(+4.97)#3,016 |
| 41. | 74834 | 8.8% | 3.7%(+5.10)#41 | 3.8%(+4.95)#3,036 |
| 42. | 73761 | 8.6% | 3.7%(+4.90)#42 | 3.8%(+4.75)#3,178 |
| 43. | 73093 | 8.6% | 3.7%(+4.89)#43 | 3.8%(+4.74)#3,189 |
| 44. | 74941 | 8.4% | 3.7%(+4.69)#44 | 3.8%(+4.54)#3,351 |
| 45. | 73562 | 8.2% | 3.7%(+4.53)#45 | 3.8%(+4.38)#3,473 |
| 46. | 74942 | 8.2% | 3.7%(+4.50)#46 | 3.8%(+4.35)#3,509 |
| 47. | 74855 | 8.1% | 3.7%(+4.44)#47 | 3.8%(+4.29)#3,572 |
| 48. | 74022 | 7.9% | 3.7%(+4.27)#48 | 3.8%(+4.12)#3,720 |
| 49. | 73531 | 7.9% | 3.7%(+4.20)#49 | 3.8%(+4.05)#3,795 |
| 50. | 74825 | 7.8% | 3.7%(+4.16)#50 | 3.8%(+4.01)#3,836 |
| 51. | 73573 | 7.8% | 3.7%(+4.16)#51 | 3.8%(+4.01)#3,838 |
| 52. | 73173 | 7.7% | 3.7%(+4.02)#52 | 3.8%(+3.88)#3,968 |
| 53. | 74530 | 7.7% | 3.7%(+4.02)#53 | 3.8%(+3.88)#3,982 |
| 54. | 74344 | 7.6% | 3.7%(+3.98)#54 | 3.8%(+3.83)#4,036 |
| 55. | 74137 | 7.6% | 3.7%(+3.97)#55 | 3.8%(+3.82)#4,041 |
| 56. | 74865 | 7.6% | 3.7%(+3.92)#56 | 3.8%(+3.77)#4,080 |
| 57. | 73142 | 7.6% | 3.7%(+3.89)#57 | 3.8%(+3.74)#4,106 |
| 58. | 73014 | 7.4% | 3.7%(+3.77)#58 | 3.8%(+3.62)#4,228 |
| 59. | 74832 | 7.4% | 3.7%(+3.75)#59 | 3.8%(+3.60)#4,256 |
| 60. | 74837 | 7.4% | 3.7%(+3.74)#60 | 3.8%(+3.59)#4,271 |
| 61. | 74131 | 7.4% | 3.7%(+3.71)#61 | 3.8%(+3.56)#4,303 |
| 62. | 73835 | 7.4% | 3.7%(+3.71)#62 | 3.8%(+3.56)#4,304 |
| 63. | 73838 | 7.2% | 3.7%(+3.55)#63 | 3.8%(+3.40)#4,497 |
| 64. | 73550 | 7.2% | 3.7%(+3.48)#64 | 3.8%(+3.33)#4,556 |
| 65. | 73054 | 7.0% | 3.7%(+3.37)#65 | 3.8%(+3.22)#4,718 |
| 66. | 73801 | 7.0% | 3.7%(+3.33)#66 | 3.8%(+3.18)#4,773 |
| 67. | 73065 | 6.9% | 3.7%(+3.27)#67 | 3.8%(+3.12)#4,842 |
| 68. | 73663 | 6.9% | 3.7%(+3.21)#68 | 3.8%(+3.06)#4,928 |
| 69. | 73755 | 6.9% | 3.7%(+3.20)#69 | 3.8%(+3.05)#4,940 |
| 70. | 73013 | 6.9% | 3.7%(+3.20)#70 | 3.8%(+3.05)#4,943 |
| 71. | 74756 | 6.8% | 3.7%(+3.16)#71 | 3.8%(+3.01)#4,995 |
| 72. | 73947 | 6.8% | 3.7%(+3.11)#72 | 3.8%(+2.96)#5,065 |
| 73. | 73120 | 6.7% | 3.7%(+3.07)#73 | 3.8%(+2.92)#5,132 |
| 74. | 73664 | 6.7% | 3.7%(+3.02)#74 | 3.8%(+2.87)#5,202 |
| 75. | 74331 | 6.7% | 3.7%(+3.01)#75 | 3.8%(+2.86)#5,217 |
| 76. | 74081 | 6.7% | 3.7%(+3.00)#76 | 3.8%(+2.85)#5,237 |
| 77. | 74572 | 6.7% | 3.7%(+3.00)#77 | 3.8%(+2.85)#5,241 |
| 78. | 73034 | 6.7% | 3.7%(+2.99)#78 | 3.8%(+2.84)#5,264 |
| 79. | 73103 | 6.7% | 3.7%(+2.98)#79 | 3.8%(+2.83)#5,270 |
| 80. | 74079 | 6.6% | 3.7%(+2.94)#80 | 3.8%(+2.79)#5,338 |
| 81. | 73041 | 6.6% | 3.7%(+2.90)#81 | 3.8%(+2.75)#5,403 |
| 82. | 73673 | 6.5% | 3.7%(+2.87)#82 | 3.8%(+2.72)#5,433 |
| 83. | 73015 | 6.5% | 3.7%(+2.80)#83 | 3.8%(+2.65)#5,528 |
| 84. | 73027 | 6.5% | 3.7%(+2.78)#84 | 3.8%(+2.63)#5,552 |
| 85. | 73762 | 6.4% | 3.7%(+2.73)#85 | 3.8%(+2.58)#5,641 |
| 86. | 74105 | 6.4% | 3.7%(+2.70)#86 | 3.8%(+2.55)#5,679 |
| 87. | 74864 | 6.3% | 3.7%(+2.60)#87 | 3.8%(+2.45)#5,856 |
| 88. | 73010 | 6.2% | 3.7%(+2.58)#88 | 3.8%(+2.43)#5,905 |
| 89. | 73150 | 6.2% | 3.7%(+2.57)#89 | 3.8%(+2.42)#5,912 |
| 90. | 73647 | 6.2% | 3.7%(+2.55)#90 | 3.8%(+2.41)#5,933 |
| 91. | 73753 | 6.2% | 3.7%(+2.51)#91 | 3.8%(+2.36)#5,996 |
| 92. | 73012 | 6.1% | 3.7%(+2.38)#92 | 3.8%(+2.23)#6,227 |
| 93. | 73938 | 6.0% | 3.7%(+2.37)#93 | 3.8%(+2.22)#6,248 |
| 94. | 73121 | 6.0% | 3.7%(+2.33)#94 | 3.8%(+2.18)#6,339 |
| 95. | 74445 | 6.0% | 3.7%(+2.32)#95 | 3.8%(+2.17)#6,353 |
| 96. | 74726 | 5.9% | 3.7%(+2.23)#96 | 3.8%(+2.08)#6,525 |
| 97. | 74338 | 5.8% | 3.7%(+2.17)#97 | 3.8%(+2.02)#6,639 |
| 98. | 73105 | 5.8% | 3.7%(+2.16)#98 | 3.8%(+2.01)#6,657 |
| 99. | 73456 | 5.8% | 3.7%(+2.12)#99 | 3.8%(+1.97)#6,723 |
| 100. | 73735 | 5.8% | 3.7%(+2.12)#100 | 3.8%(+1.97)#6,731 |
Common Questions
What are the Top 10 Zip Codes with the Highest Percentage of Self-Employed / Incorporated in Oklahoma?
Top 10 Zip Codes with the Highest Percentage of Self-Employed / Incorporated in Oklahoma are:
What zip code has the Highest Percentage of Self-Employed / Incorporated in Oklahoma?
74477 has the Highest Percentage of Self-Employed / Incorporated in Oklahoma with 100.0%.
What is the Percentage of Self-Employed / Incorporated in the State of Oklahoma?
Percentage of Self-Employed / Incorporated in Oklahoma is 3.7%.
What is the Percentage of Self-Employed / Incorporated in the United States?
Percentage of Self-Employed / Incorporated in the United States is 3.8%.